• Matter and Radiation at Extremes
  • Vol. 4, Issue 6, 065401 (2019)
H. Peng1、2、3、*, J.-R. Marquès4, L. Lancia4, F. Amiranoff5, R. L. Berger6, S. Weber7、8, and C. Riconda1
Author Affiliations
  • 1LULI, Sorbonne Université, CNRS, École Polytechnique, CEA, F-75252 Paris, France
  • 2Department of Optical Science and Engineering, Fudan University, Shanghai 200433, China
  • 3Laser Fusion Research Center, China Academy of Engineering Physics, Mianyang 621900, China
  • 4LULI, CNRS, École Polytechnique, CEA, Université Paris-Saclay, Sorbonne Université, F-91128 Palaiseau, France
  • 5LULI, Sorbonne Université, CNRS, École Polytechnique, CEA, Université Paris-Saclay, F-75252 Paris, France
  • 6Lawrence Livermore National Laboratory, Livermore, California 94550, USA
  • 7Institute of Physics of the ASCR, ELI-Beamlines Project, 18221 Prague, Czech Republic
  • 8School of Science, Xi’an Jiaotong University, Xi’an 710049, China
  • show less
    DOI: 10.1063/1.5091550 Cite this Article
    H. Peng, J.-R. Marquès, L. Lancia, F. Amiranoff, R. L. Berger, S. Weber, C. Riconda. Plasma optics in the context of high intensity lasers[J]. Matter and Radiation at Extremes, 2019, 4(6): 065401 Copy Citation Text show less
    Percentage of the pump energy transferred to the seed as a function of the seed delay time. 1D simulations are labeled by line-point, 2D by blue circles, and 3D by red squares. At tp − ts = 0 ps, the peak power of the seed and pump arrive at the maximum electron density at the same time.
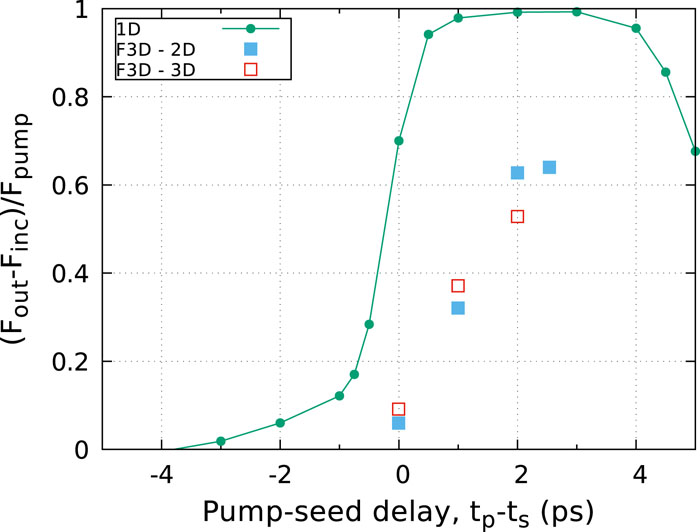
    Fig. 1. Percentage of the pump energy transferred to the seed as a function of the seed delay time. 1D simulations are labeled by line-point, 2D by blue circles, and 3D by red squares. At tpts = 0 ps, the peak power of the seed and pump arrive at the maximum electron density at the same time.
    2D and 3D simulations: Energy transfer vs incident seed intensity.
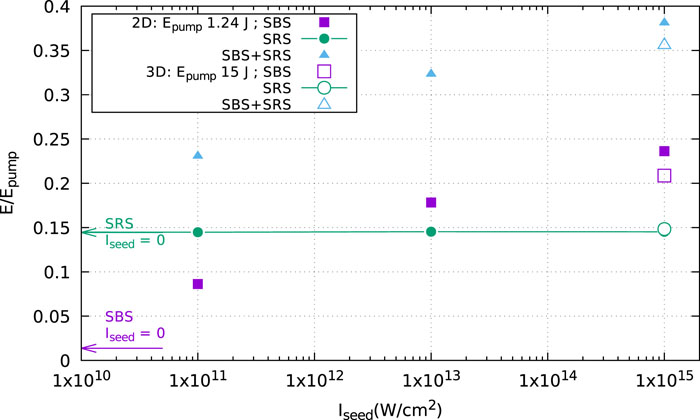
    Fig. 2. 2D and 3D simulations: Energy transfer vs incident seed intensity.
    The basic scheme using a plasma as a wave plate based on the phase evolution during the sc-SBS amplification.
    Fig. 3. The basic scheme using a plasma as a wave plate based on the phase evolution during the sc-SBS amplification.
    The amplitudes and phases of the pump and the seed at different times. Both the amplitudes of the pump and the seed are normalized to the amplitude of the pump. The phases are normalized to π. The plasma density is constant in the simulation box.
    Fig. 4. The amplitudes and phases of the pump and the seed at different times. Both the amplitudes of the pump and the seed are normalized to the amplitude of the pump. The phases are normalized to π. The plasma density is constant in the simulation box.
    The amplitudes and phases of the pump and the seed at different times. All the parameters are identical to Fig. 4 except that Gaussian pulses are used here.
    Fig. 5. The amplitudes and phases of the pump and the seed at different times. All the parameters are identical to Fig. 4 except that Gaussian pulses are used here.
    H. Peng, J.-R. Marquès, L. Lancia, F. Amiranoff, R. L. Berger, S. Weber, C. Riconda. Plasma optics in the context of high intensity lasers[J]. Matter and Radiation at Extremes, 2019, 4(6): 065401
    Download Citation