
Qi LIU, Can ZHU, Guizhen XIE, Jun WANG, Dongming ZHANG, Gangqin SHAO. Optical Absorption and Photoluminescence Spectra of Ce-doped SrMgF4 Polycrystalline with Superlattice Structure [J]. Journal of Inorganic Materials, 2022, 37(8): 897
- Journal of Inorganic Materials
- Vol. 37, Issue 8, 897 (2022)
Abstract
Perovskite-related SrMgF4 (SMF) is a ferroelectric with the largest bandgap (Eg=12.50 eV) in nature[1⇓⇓⇓⇓⇓⇓⇓⇓-10]. Banks et al.[8-9] identified its orthorhombic structure (Cmcm, Space Group No. 63, Z = 4; Pdf 89-1391/ ICSD 86248) firstly in 1980. In 2001, Ishizawa et al.[11] determined SrMgF4: 0.00006Ce crystal at 25 ℃ as a monoclinic superstructure. In 2002, Abrahams[12] predicted that a phase transition from the ferroelectric to paraelectric state at Tc~177 ℃ accompanied by two kinds of monoclinic symmetry change: m-SrMgF4 (P1121, S.G.No.4, Z=12; ICSD 279588) $\xrightarrow{\text{ }\!\!\tilde{\ }\!\!\text{ }177\text{ (}\pm \text{ }270-370)\text{ }}$m’-SrMgF4 (P1121/m, S.G.No. 11, Z = 12; ICSD 94669). Mel’nikova et al.[13] (2014) and Yelisseyev et al.[14] (2015) in the same group confirmed elaborately a low- to high- temperature (LT→HT) phase transition at ~205 ℃, close to 177 ℃ which predicted by Abrahams[12]: m-SrMgF4 (P21, S.G.No.4, Z=12; CCDC 1029322 / ICSD 193583) $\xrightarrow{\text{ }\!\!\tilde{\ }\!\!\text{ (}205\pm 1\text{ })}$ orth-SrMgF4 (Cmc21, S.G.No.36, Z=4; CCDC 1029321/ICSD 193584)[13-14].
As for RE-doped AMF4 (A-one of the alkaline, alkali-earth or RE elements; M-one of the alkali-earth or transition-metal (TM) elements with the octahedral coordination MF6), the bright emission from RE ions can be widely applied in fluorescent lamps, plasma display panels, light emitting diodes (LEDs), solar concentrators,
phosphors and bulk lasers because AMF4 is the effective acceptor for RE dopants. Examples are listed as follows: Ce3+[11,15]/Sm2+[16-17]/Gd3+[18]/Er2+[2]-doped SrMgF4, Ce3+-doped BaNiF4[19], Ce3+/Eu2+-doped and (Ce3+, Eu2+) co-doped KMgF4[20], Ce3+[21-26]/Nd3+[22]/Eu2+[22,27]/Gd3+[18]/ Tb3+[21]-doped, (Ce3+, Na+)[28-29] co-doped and (Ce3+, Mn2+)[22] co-doped BaMgF4, and so on. The single-crystal SrMgF4 can be synthesized by a vertical Bridgman method using binary fluorides (SrF2/MgF2) as raw materials[5,13,14,30-31]. Methods to prepare SrMgF4 polycrystalline powders include the solid-state method[8-9,17] using binary fluorides (SrF2/MgF2) directly as well, the mechanochemical method using Mg(OH)2, Sr(Ac)2 and NH4F[32], and the solution chemical route using soluble salts and NH4F/NH4HF2[2,33⇓-35] as raw materials.
In this work, SrMgF4: Ce polycrystalline powders were prepared and their phase structure, electrovalence and photoluminescence (PL) spectra were investigated.
1 Experimental
Ce-doped SrMgF4 powders were synthesized through a precipitation method using SrCO3 (≥99.99%, mass percent), Mg(CH3COO)2·4H2O (≥99.9%, mass percent), Ce(NO3)3·6H2O (≥99.99%, mass percent), NH4HF2 (≥98.0%, mass percent) and CH3COOH (≥99.5%, mass percent) as raw materials[33-34]. Molar ratios of initial mixtures were (1-x)SrCO3: 1 Mg(CH3COO)2·4H2O: xCe(NO3)3·6H2O. The SrCO3 was dissolved by mole percent 10% excessive diluted acetic acid (0.2 mol/L), then the Mg(CH3COO)2·4H2O and Ce(NO3)3·6H2O were dissolved in the solution successively according to the stoichiometric amount. The mixed solution was added dropwise to mass percent 10% excessive diluted NH4HF2 (0.3 mol/L) and kept stirring in a Teflon beaker. A white floc was formed and then turned into a precipitation. The precipitation was dried at 80 ℃ for 48 h, washed by deionized water, dried again at 80 ℃ for 3 h. Last, dried white powders were calcined at 400 ℃ in air for 1 h, resulting in the final SrMgF4: xCe powders (x = 0, 0.007, 0.013 and 0.035, mole composition measured by Inductively Coupled Plasma-optical emission spectrometer (ICP); samples labeled hereafter as SMF, SMF: 0.007Ce, SMF: 0.013Ce and SMF: 0.035Ce). The difference between the measured and nominal mole composition came mainly from the purity, hydrate content and filtration process[31]. Reaction equations are listed as follows:
(Sr, Mg, Ce)F2+δ + NH3↑ + HAc↑ + HNO3↑ + H2O↑ + HF↑$\xrightarrow{\text{washed, dried, calcined}400\text{ }\text{ for 1 h, in air}}$SrMgF4: xCe (x = 0, 0.007, 0.013 and 0.035).
The crystal structure and phase purity of samples were identified by XRD (Empyrean, PANalytical Ltd., Netherlands) with step size of 0.01° and scanning rate of 0.02 (°)/s, using the CuKα1 radiation (λ = 0.15406 nm at 40 kV and 40 mA). The actual compositions of samples were determined by ICP (Prodigy 7, Leeman Labs Inc., USA), while powders dissolved completely in a nitrohydrochloric acid in advance. Electrovalence measurements were carried by an X-ray photoelectron spectrograph (XPS, Multilab 2000, VG Inc., USA) equipped with a focused monochromatized AlKα X-ray source (hν = 1486.6 eV). Binding energies were calibrated by fixing the saturated hydrocarbon component of the C1s peak at 284.8 eV. Absorption spectra were obtained using an ultraviolet/visual/near-infrared (UV/VIS/NIR) spectrometer (Lambda 750S, PerkinElmer, USA). Photoluminescence excitation and emission spectra were recorded on a fluorescence spectrophotometer (F-7000, Hitachi, Japan) at bias potential of 700 V. All measurements were carried out at room temperature (RT).
2 Results and discussion
2.1 Phase structures
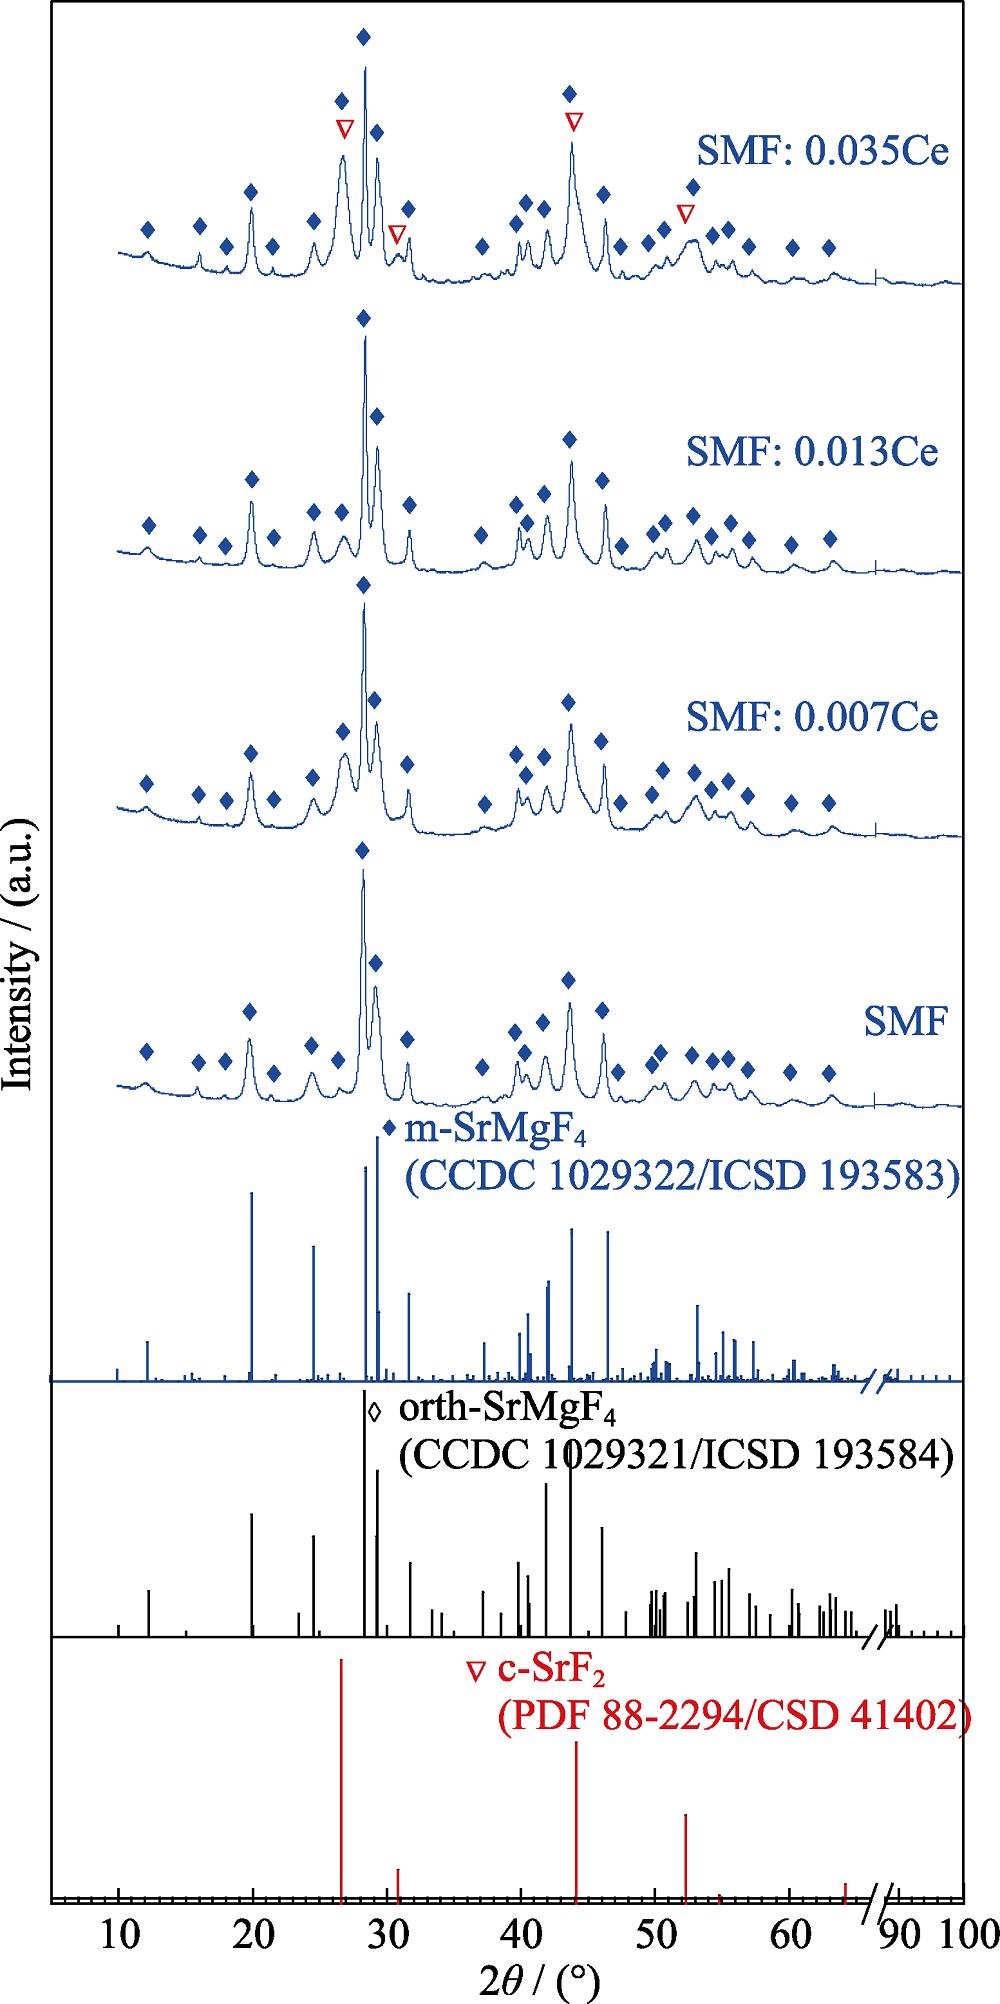
In Fig. 1, XRD patterns of Ce-doped SrMgF4 powders reveal that monoclinic LT-SrMgF4 with superstructures (P21, S.G.No. 4, Z = 12; CCDC 1029322/ ICSD 193583[14]) are formed in SMF, SMF: 0.007Ce and SMF: 0.013Ce samples. The monoclinic superstructures have doubled a and tripled c cell-length via the orthorhombic unit cell in HT-SrMgF4 phases (Cmc21, S.G.No.36, Z = 4; CCDC 1029321/ICSD 193584)[13-14]. When the dopant content reached 3.5% (SMF: 0.035Ce), the cubic SrF2 impurity was found. There was no indication of MgF2 phase in all samples.
![]()
Figure 1.XRD patterns of SrMgF4:
Compared to XRD patterns of orthorhombic HT- SrMgF4, those of monoclinic LT-phases with superstructures are almost the same besides some characteristic peaks appearing at 2θ=16.1°, 18.1°, 21.6°, (26.8±0.2)°, and so on. This confirms the formation of SrMgF4: xCe perovskite-like fluoride solid solutions (x=0, 0.007, 0.013 and 0.035). Considering that Ce3+/4+ and Sr2+ ions have close effective ionic radii (r)[36] and the coordination number (CN) of Sr2+ in monoclinic LT-SrMgF4 is 7-11[11,14-15], it can be concluded that monoclinic LT- SrMgF4 with superstructures originate from substitution by the Ce3+/4+ (${{r}_{\text{C}{{\text{e}}^{\text{3+}}}}}$=0.107-0.134 nm while $\text{C}{{\text{N}}_{\text{C}{{\text{e}}^{\text{3+}}}}}$=7-12; ${{r}_{\text{C}{{\text{e}}^{\text{4+}}}}}$=0.097-0.114 nm while $\text{C}{{\text{N}}_{\text{C}{{\text{e}}^{\text{4+}}}}}$=8-12) for Sr2+ (${{r}_{\text{S}{{\text{r}}^{\text{2+}}}}}$=0.121-0.144 nm while $\text{C}{{\text{N}}_{\text{S}{{\text{r}}^{\text{2+}}}}}$= 7-12) in the polyhedra composed of F- ligand ions.
2.2 XPS results
The core level XPS spectra of SMF, SMF: 0.007Ce, SMF: 0.013Ce and SMF: 0.035Ce powders are shown in Fig. 2. Spectral features are fitted with Gaussian distributions and then peak positions and areas are determined. A high symmetric peak originating from the F1s is observed at ~685 eV. The O1s peak at 532.5 eV is determined as the absorbed oxygen (530.0-531.5 eV) other than the lattice oxygen (527.5-530.0 eV)[19]. The peak at 50.6 eV is from Mg2p. The Sr3d spectra show a pair of spin-orbit split components at 135.5 eV (Sr 3d3/2) and 133.5 eV (Sr 3d5/2)[5]. Two major peaks at 902.6 and 884.3 eV found in SMF: 0.007Ce, SMF: 0.013Ce and SMF: 0.035Ce powders are determined as Ce3d3/2 and Ce3d5/2 doublets, which provides direct evidence of Ce3+-doping in the SrMgF4 host (Fig. 2(a))[37-38].
![]()
Figure 2.XPS spectra of SrMgF4:
The coexistence of Ce3+ and Ce4+ in SMF: 0.007Ce, SMF: 0.013Ce and SMF: 0.035Ce samples are evidenced by a shoulder observed on main peaks of Ce3d3/2 and Ce3d5/2 (Fig. 2(b)). They are composed of eight peaks corresponding to four pairs of spin-orbit doublets according to previous reports[37⇓-39]. Peaks marked by u, u', u″ and u‴ are attributed to Ce3d3/2, whereas those marked by v, v', v″ and v‴ are assigned to Ce3d5/2. Sub-bands labeled u'(902.6 eV) and v'(884.3 eV) represent the 3d104f1 initial electronic state corresponding to Ce3+, and sub-bands labeled u(900.7 eV), u″(906.0 eV), u‴(916.3 eV), v(882.3 eV), v''(887.7 eV) and v‴(898.0 eV) represent the 3d104f0 state of Ce4+. The Ce3+/(Ce3++Ce4+) ratios in SMF: 0.007Ce, SMF: 0.013Ce and SMF: 0.035Ce samples are 53.9%, 50.9% and 44.1%, respectively. The ratios decreased with the Ce content increasing.
2.3 Absorption / photoluminescence spectra
Absorption spectra of SrMgF4:xCe (x=0, 0.007, 0.013 and 0.035) at RT consist of four bands (Fig. 3) at 212 nm (a1), 226 nm (a2), (258±4) nm (B) and (291± 1) nm (C) in the UV region (the errors for wavelengths represent wavelength range/change/shift originated from different Ce-doping contents, the same hereinafter). The band a1 is close to the edge of UV region. The band a2 is associated with radiative recombination in some non-identified point defects such as color centers based on anion vacancies, structural defects in cation sub-lattices or impurity defects. Bands B and C correspond to the energy levels of 5d1 excited states of Ce3+-polyhedra[15].
![]()
Figure 3.Absorption spectra of SrMgF4:
Fluorescence bands of emission spectra (Fig. 4) are obtained with double peaks at (313±3)/(339±3) nm when samples are excited at λex=258 nm (band B) and 295 nm (band C), coincided with two of the absorption bands. Stokes shift (ΔS) represents the wavelength difference between positions of the band maxima of absorption and fluorescence emission spectra of the same electronic transition. The band C decomposes into two Gaussians (i.e. excitation band C@~316/339 nm) as a function of energy in the form $I(x)=\sum{{{I}_{i}}\exp \left( -\frac{{{(x-{{x}_{c}})}^{2}}}{2x_{w}^{2}} \right)}$, where Ii is the amplitude, xc is the peak center and xw the peak width[15,28]. They are assigned to the electric dipole-allowed 5d–4f transitions, from the 4f1 (2F5/2) ground state to the excited-level 5d1 (${}^{2}D_{3/2}^{{}}$) and the modified excited-level 5d1 (${}^{2}D_{3/2}^{*}$) by the crystal field (Fig. 5), i.e. 4f1 $({}^{2}F_{5/2}^{{}})$$\xrightarrow{{{\lambda }_{\text{ex}}}\text{=}295\text{ nm}}$5d1 $({}^{2}D_{3/2}^{*})$ $\xrightarrow{{{\lambda }_{\text{em}}}\text{= }\!\!\tilde{\ }\!\!\text{ 315 / }338(\pm 3)\text{ nm}}$ 4f1 (${}^{2}F_{5/2}^{{}}$)/4f1 (${}^{2}F_{7/2}^{{}}$)[21,40-41]. Therefore, the energy difference (${{\Delta }_{\text{F}}}$) between 4f1 (${}^{2}F_{5/2}^{{}}$) and 4f1 (${}^{2}F_{7/2}^{{}}$) levels is ~2147 cm–1, in good agreement with the reported value of 2200[15], 2000[42] and 1795[21] cm–1. It can be approximated to the crystal-field-splitting energy of ground states between $t_{2g}^{{}}$ ($\text{d}_{xy}^{{}}$, $\text{d}_{yz}^{{}}$, $\text{d}_{zx}^{{}}$) and $e_{g}^{{}}$ ($\text{d}_{{{z}^{2}}}^{{}}$, $\text{d}_{{{x}^{2}}-{{y}^{2}}}^{{}}$) for Ce3+ ions. Otherwise, the intensity of excitation band C increases with increment of the Ce3+ concentration (0<x≤0.035%).
![]()
Figure 4.Emission/excitation spectra of SrMgF4:
![]()
Figure 5.Energy levels observed in SrMgF4:
Excitation spectra (Fig. 4) obtained by monitoring the fluorescence intensity at λem = 315/336 nm include both components of excitation bands B and C, because of the overlap of the high energy component of band C and low energy component of band B[15,28]. The zero-phonon line, where excitation and emission spectra overlap with each other, were observed at 310 nm. In Ce-doped SrMgF4, absorption/excitation bands of Ce3+ ion with [Xe]4f15d06s0 electronic configuration in trigonal symmetry[28] correspond to electronic-dipole transition, which is from the 4f1 (2F5/2, 7/2) ground-state to the 5d1 (2D3/2, 5/2) excited-state. The energy level of the excited-state 5d1 (2D3/2) can be estimated from the excitation band B ((264±2)/ (264±1) nm). Thus, B site is assigned to Ce3+ occupying the ordinary sites of Sr2+[15,25,28]. Lowering symmetry of C site is derived from the spread of B excitation bands. Taking account of the Ce3+-concentration dependence and inhomogeneous broadening of band C ((293±2)/ (293±1) nm), C site is assigned to Ce3+ with the distribution of the crystal field. Energy levels of the 5d1 excited states were modified strongly by the crystal field when the symmetry of Ce3+-polyhedra changed from high- (orthorhombic) to low- (monoclinic) symmetry[15,24-25,28].
3 Conclusions
In the synthesized SrMgF4: xCe (x=0, 0.007, 0.013 and 0.035) powders, pure phases with monoclinic superstructures were found at x=0, 0.007 and 0.013. Absorption and photoluminescence spectra show Ce- doped SrMgF4 samples have two primary absorption peaks at 258/295 nm and two emission peaks at 315/ 336 nm in the UV region at room temperature, which have similar line-shape and line-width except for their peak shift. They are assigned to the Ce3+-polyhedra with a strong crystal field as a consequence of the monoclinic superstructures.
2001~2003年,我师从郭景坤先生做博士后工作,有幸站在两个国家重点实验室的平台上从事金属-非金属复合材料研究。在此期间和之后的研究,我一直受教于先生的指点,使有关国家级和军工项目得以顺利完成。先生给我最深的印象之一是他对科研前沿的敏锐判断力。记得我曾就一种金属-陶瓷界面结合和离子掺杂改性的问题向先生请教,他的反应之快和精准预测令我惊叹!先生给我最深的印象之二是他的英语水平很高。他曾告诉我,他们那代人没有系统学习和培训过英语,就靠自已常看常用。我曾数次陪同先生与国外专家进行学术交流,先生所作的学术报告和日常对话令我和同事以及硕博学生们都钦佩不已!一晃20多年过去,在国际视野下进行学术研究仍是我的坚持,先生的教诲我铭记在心!
(邵刚勤)
References
[3] A Y SOFRONOVA, V A PUSTOVAROV, I N OGORODNIKOV. Radiation-induced defects in SrMgF4 single crystals irradiated by fast electrons. AIP Conference Proceedings, 020172(2019).
[11] N ISHIZAWA, K SUDA, B E ETSCHMANN et al. Monoclinic superstructure of SrMgF4 with perovskite-type slabs. Acta Crystallographica Section C, 784-786(2001).
[12] S C ABRAHAMS. Structurally ferroelectric SrMgF4. Acta Crystallographica Section B, 34-37(2002).
[28] E HAYASHI, K ITO, S YABASHI et al. Vacuum ultraviolet and ultraviolet spectroscopy of BaMgF4 co-doped with Ce3+ and Na+. Journal of Luminescence, 69-74(2006).
[29] E HAYASHI, K ITO, S YABASHI et al. Ultraviolet irradiation effect of Ce3+-doped BaMgF4 crystals. Journal of Alloys and Compounds, 883-885(2006).
[33] Q LIU. Photoluminescence properties of rare-earth Ce-doped SrMgF4 powder prepared through a wet-chemical route. Wuhan: Master Thesis of Wuhan University of Technology(2019).
[34] D M ZHANG, Q LIU, G Q SHAO et al. The Ce-doped SrMgF4 fluorescent materials and their preparation method thereof. Chinese Invention Patent, Appl.
[36] R D SHANNON. Revised effective ionic radii and systematic studies of interatomic distances in halides and chalcogenides. Acta Crystallographica, 751-767(1976).
[38] D W JEONG, H S NA, J O SHIM et al. A crucial role for the CeO2-ZrO2 support for the low temperature water gas shift reaction over Cu-CeO2-ZrO2 catalysts. Catalysis Science & Technology, 3706-3713(2015).
[40] E V D LOEF, P DORENBOS, C W E EIJK et al. Scintillation properties of LaBr3: Ce3+ crystals: fast, efficient and high-energy- resolution scintillators. IEEE Transactions on Nuclear Science, 254-258(2002).

Set citation alerts for the article
Please enter your email address
© Copyright 2018-2021 | Chinese Laser Press. All Rights Reserved 沪ICP备15018463号-20