
L. Castañeda. Transparent conductive stannic oxide coatings employing an ultrasonic spray pyrolysis technique: The relevance of the molarity content in the aerosol solution for improvement the electrical properties[J]. Journal of Semiconductors, 2022, 43(2): 022802
- Journal of Semiconductors
- Vol. 43, Issue 2, 022802 (2022)
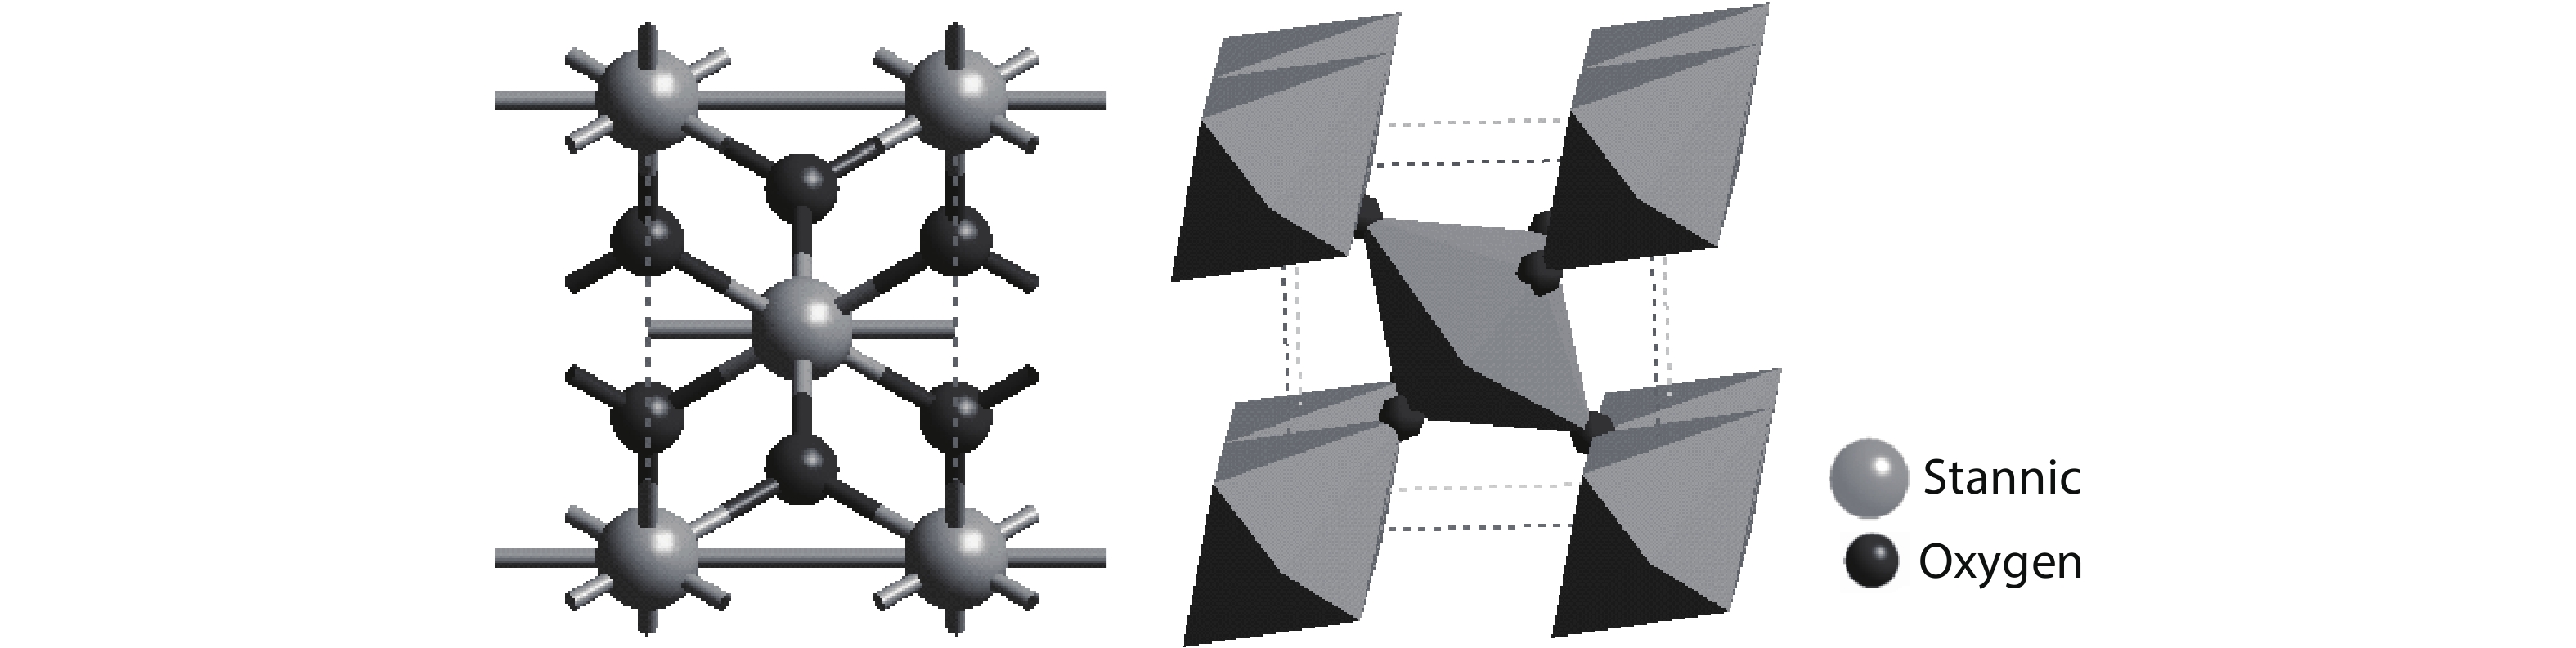
Fig. 1. Crystal structure and coordination polyhedron of the stannic oxide (cassiterite).
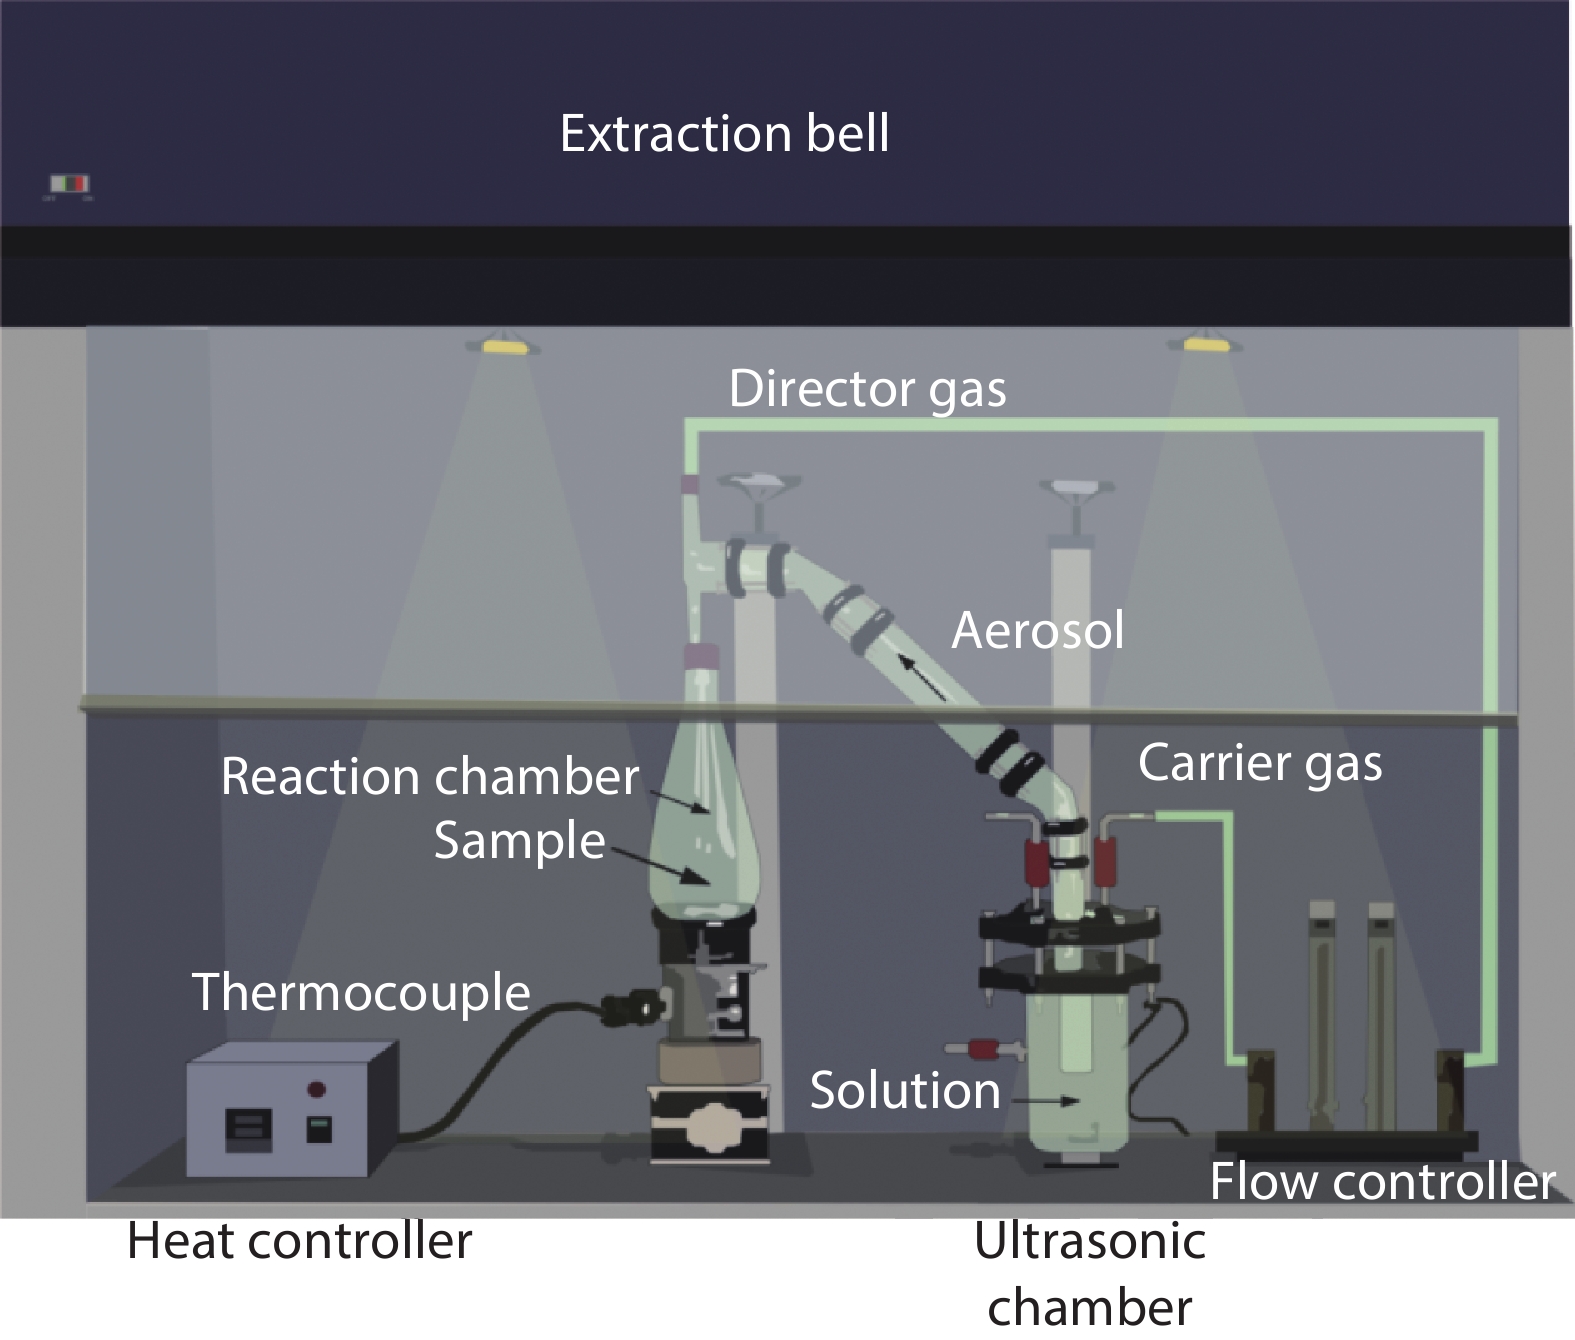
Fig. 2. (Color online) Illustration of the experimental method employed for the deposition process of the stannic oxide coatings by the USP.
Fig. 3. (Color online) (a) XRD patterns and (b) Williamson–Hall plot of the as grown samples.
Fig. 4. Scanning electron microscope images of the stannic oxide coatings for different molarities (a) 0.05 M, (b) 0.15 M, (c) 0.20 M and (d) 0.30 M.
Fig. 5. (Color online) (a) Variation of thickness and roughness of coatings with doping and (b) variation of refractive index and extinction coefficient of films at 632.8 nm with doping concentration.
Fig. 6. (Color online) (a) Transmission spectra and (b) Tauc plot of pristine SnO2 coatings.
Fig. 7. (Color online) (a) Photoluminescence spectra and (b) Commission Internationale de l'éclairage (CIE) diagram of the SnO2 coatings for different molarities.
Fig. 8. (Color online) (a) Variation of conductivity, and mobility with molarity of aerosol solution and (b) Arrhenius plot of SnO2 coating from 0.2 M in the aerosol solution.
Fig. 9. Transient photoconductivity of as grown SnO2 coatings for different molarities (a) 0.05 M, (b) 0.15 M, (c) 0.20 M and (d) 0.30 M.
| |||||||||||||||||||||||||||
Table 1. Crystallite size, dislocation density, and lattice strain of SnO2 coatings for different molarities.
|
Table 2. Texture coefficient (T C) of each (hkl ) plane.
|
Table 3. Ellipsometry and profilometry analysis of SnO2 coatings for different molarities.
|
Table 4. CIE coordinates of samples from various molarity of the aerosol solution.
|
Table 5. Electrical proprieties of the stannic oxide coatings.

Set citation alerts for the article
Please enter your email address
© Copyright 2018-2021 | Chinese Laser Press. All Rights Reserved 沪ICP备15018463号-20