
Bao-Kai MA, Mian LI, Ling-Zhi CHEONG, Xin-Chu WENG, Cai SHEN, Qing HUANG. Enzyme-MXene Nanosheets: Fabrication and Application in Electrochemical Detection of H2O2 [J]. Journal of Inorganic Materials, 2020, 35(1): 131
- Journal of Inorganic Materials
- Vol. 35, Issue 1, 131 (2020)
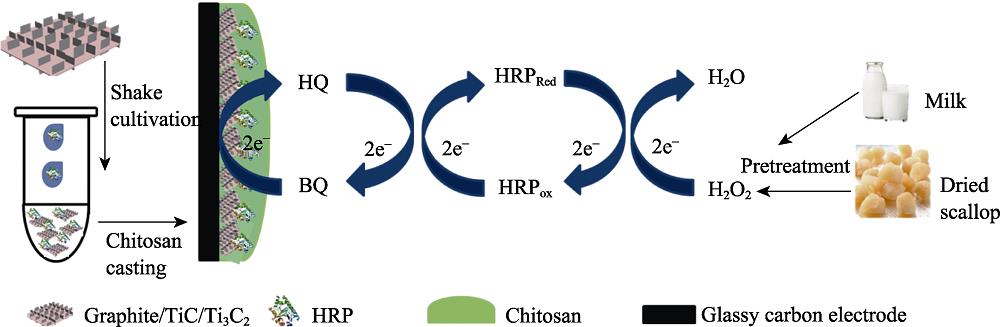
. Schematic illustration for fabrication of HRP@MXene (Graphite/TiC/Ti3C2)/chitosan/GCE and H2O2 sensing principle of HRP@MXene/chitosan/GCE
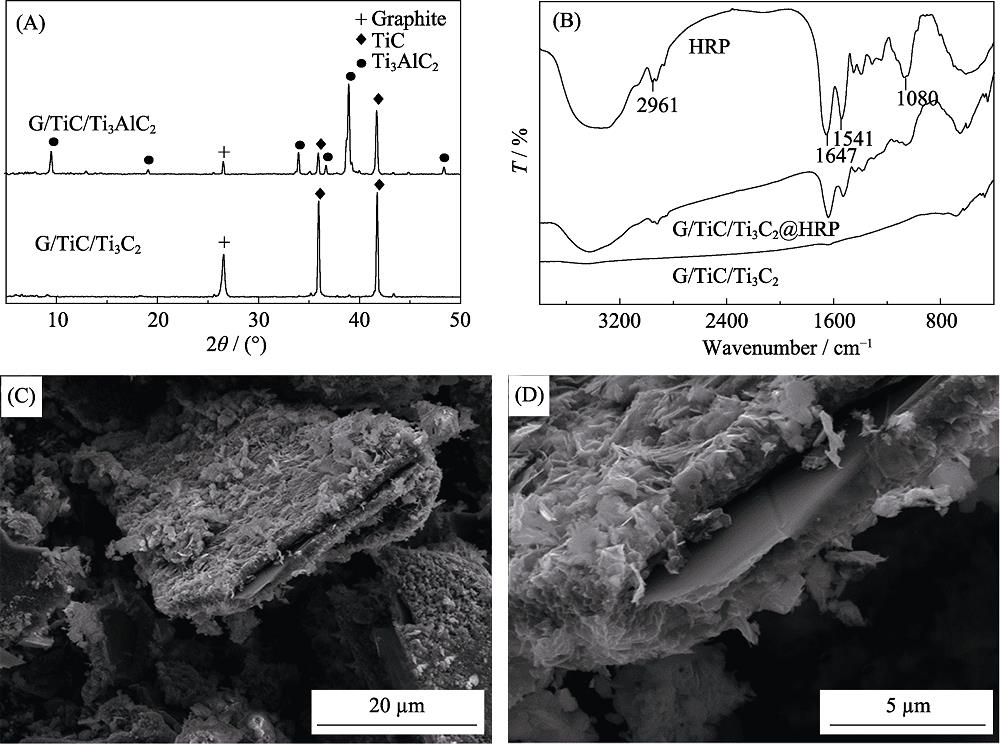
. XRD patterns of G/TiC/Ti3AlC2 and G/TiC/Ti3C2 (A); FT-IR spectra of the MXene, HRP and HRP@MXene (B); SEM images of the MXene G/TiC (C) and Ti3C2 (D)
. EIS of Chit(chitosan)/GCE(a), MXene/Chit/GCE(b), HRP@MXene/Chit/GCE (c) electrodes cycled in 0.1 mol•L-1 KCL aqueous solution containing 5 mmol•L-1 [Fe(CN)6]3-/4- (A); CV curves of Chit/GCE (a), MXene/Chit/GCE (b), HRP@MXene/Chit/GCE (c) electrodes cycled in 0.1 mol•L-1 KCL aqueous solution containing 5 mmol•L-1 [Fe(CN)6]3-/4-: (potential window: -0.1-0.5 V vs . SCE) (B)
. CV curves of Chit/GCE (curve a, black line), MXene/ Chit/GCE (curve b, red line), HRP/Chit/GCE (curve c, pink line), HRP@MXene/Chit/GCE (curve d, blue line) electrodes cycled in N2-saturated 0.1 mol•L-1 PBS (pH 7.5) containing 1.0 mmol•L-1 HQ and 2.0 mmol•L-1 H2O2 at a scanning rate of 50 mV•s-1 (potential window: -0.8-0.8 V vs . SCE).
. Amperometric responses of HRP@MXene/Chit/ GCE at -0.1 V upon successive additions of H2O2 in astirred 0.1 mol•L-1 PBS (pH 7.5) (A); Calibration curve of amperometric responses at different H2O2 concentrations (B); Amperometric responses of HRP@MXene/Chit/ GCE at -0.1 V upon successive additions of solutions extracted from milk sample (C) and dried scallop (D) spiked with different H2O2 under stirred 0.1 mol•L-1 PBS (pH 7.5)
. EIS of various electrodes in 0.1 mol•L-1 KCL aqueous solution containing 5 mmol•L-1 [Fe(CN)6]3-/4-: Chit (pH 5.0)/GCE (curve b, red line), Chit (pH 6.0)/GCE (curve c, blue line) , Chit (pH 6.5)/GCE (curve d, green line), Chit (pH 7.0)/GCE (curve e, pink line) (A); CV curves of Chit (pH 5.0)/GCE (curve b, red line), Chit (pH 6.0)/GCE (curve c, blue line) , Chit (pH 6.5)/GCE (curve d, green line) , Chit (pH 7.0)/GCE (curve e, pink line) electrodes cycled in 0.1 mol•L-1 KCL aqueous solution containing 5 mmol•L-1 [Fe(CN)6]3-/4-: (potential window: -0.1-0.5 V vs . SCE) (B)
. CV curves of HRP@MXene/Chit/GCE electrodes cycled in N2-saturated 0.1 mol•L-1 PBS (pH 7.5) containing 1.0 mmol•L-1 HQ and 2.0 mmol•L-1 H2O2 at a different scanning rates (20-500 mV•s-1) (A); Plot of cathodic and anodic peak current for HRP@MXene/Chit/GCE versus scanning rate (B); Inset: Plots of anodic peak potential and cathodic peak potential for HRP@MXene/Chit/GCE electrode versus the logarithm of scan rate
. Effects of PBS buffer’s pH (A) and concentration of MXene (B) on the cathodic peak current of enzyme biosensor cycled in N2-saturated 0.1 mol•L-1 PBS ( pH 7.5) containing 1.0 mmol•L-1 HQ and 2.0 mmol•L-1 H2O2; Effects of PBS buffer’s pH (C) and concentration of MXene (D) on the DPV response of enzyme biosensor cycledin N2-saturated 0.1 mol•L-1 PBS (pH 7.5) containing 1.0 mmol•L-1 HQ and 2.0 mmol•L-1 H2O2
. Amperometric response of HRP@MXene/Chit/GCE in 0.1 mol•L-1 pH 7.5 PBS containing 100 mmol•L-1 of ascorbic acid, glucose, uric acid and H2O2 (Applied potential: -0.1 V) (A); Reduction peak currents of HRP@MXene/Chit/GCE stored in 50 mmol•L-1 PBS (pH 7.5) at 4 for 10 d (B)
|
Table 1.
Comparison of the performance of present work with other published electrodes for hydrogen peroxide detection
|
Table 2.
Detection of hydrogen peroxide in real food sample

Set citation alerts for the article
Please enter your email address
© Copyright 2018-2021 | Chinese Laser Press. All Rights Reserved 沪ICP备15018463号-20