• Journal of Semiconductors
  • Vol. 43, Issue 3, 032001 (2022)
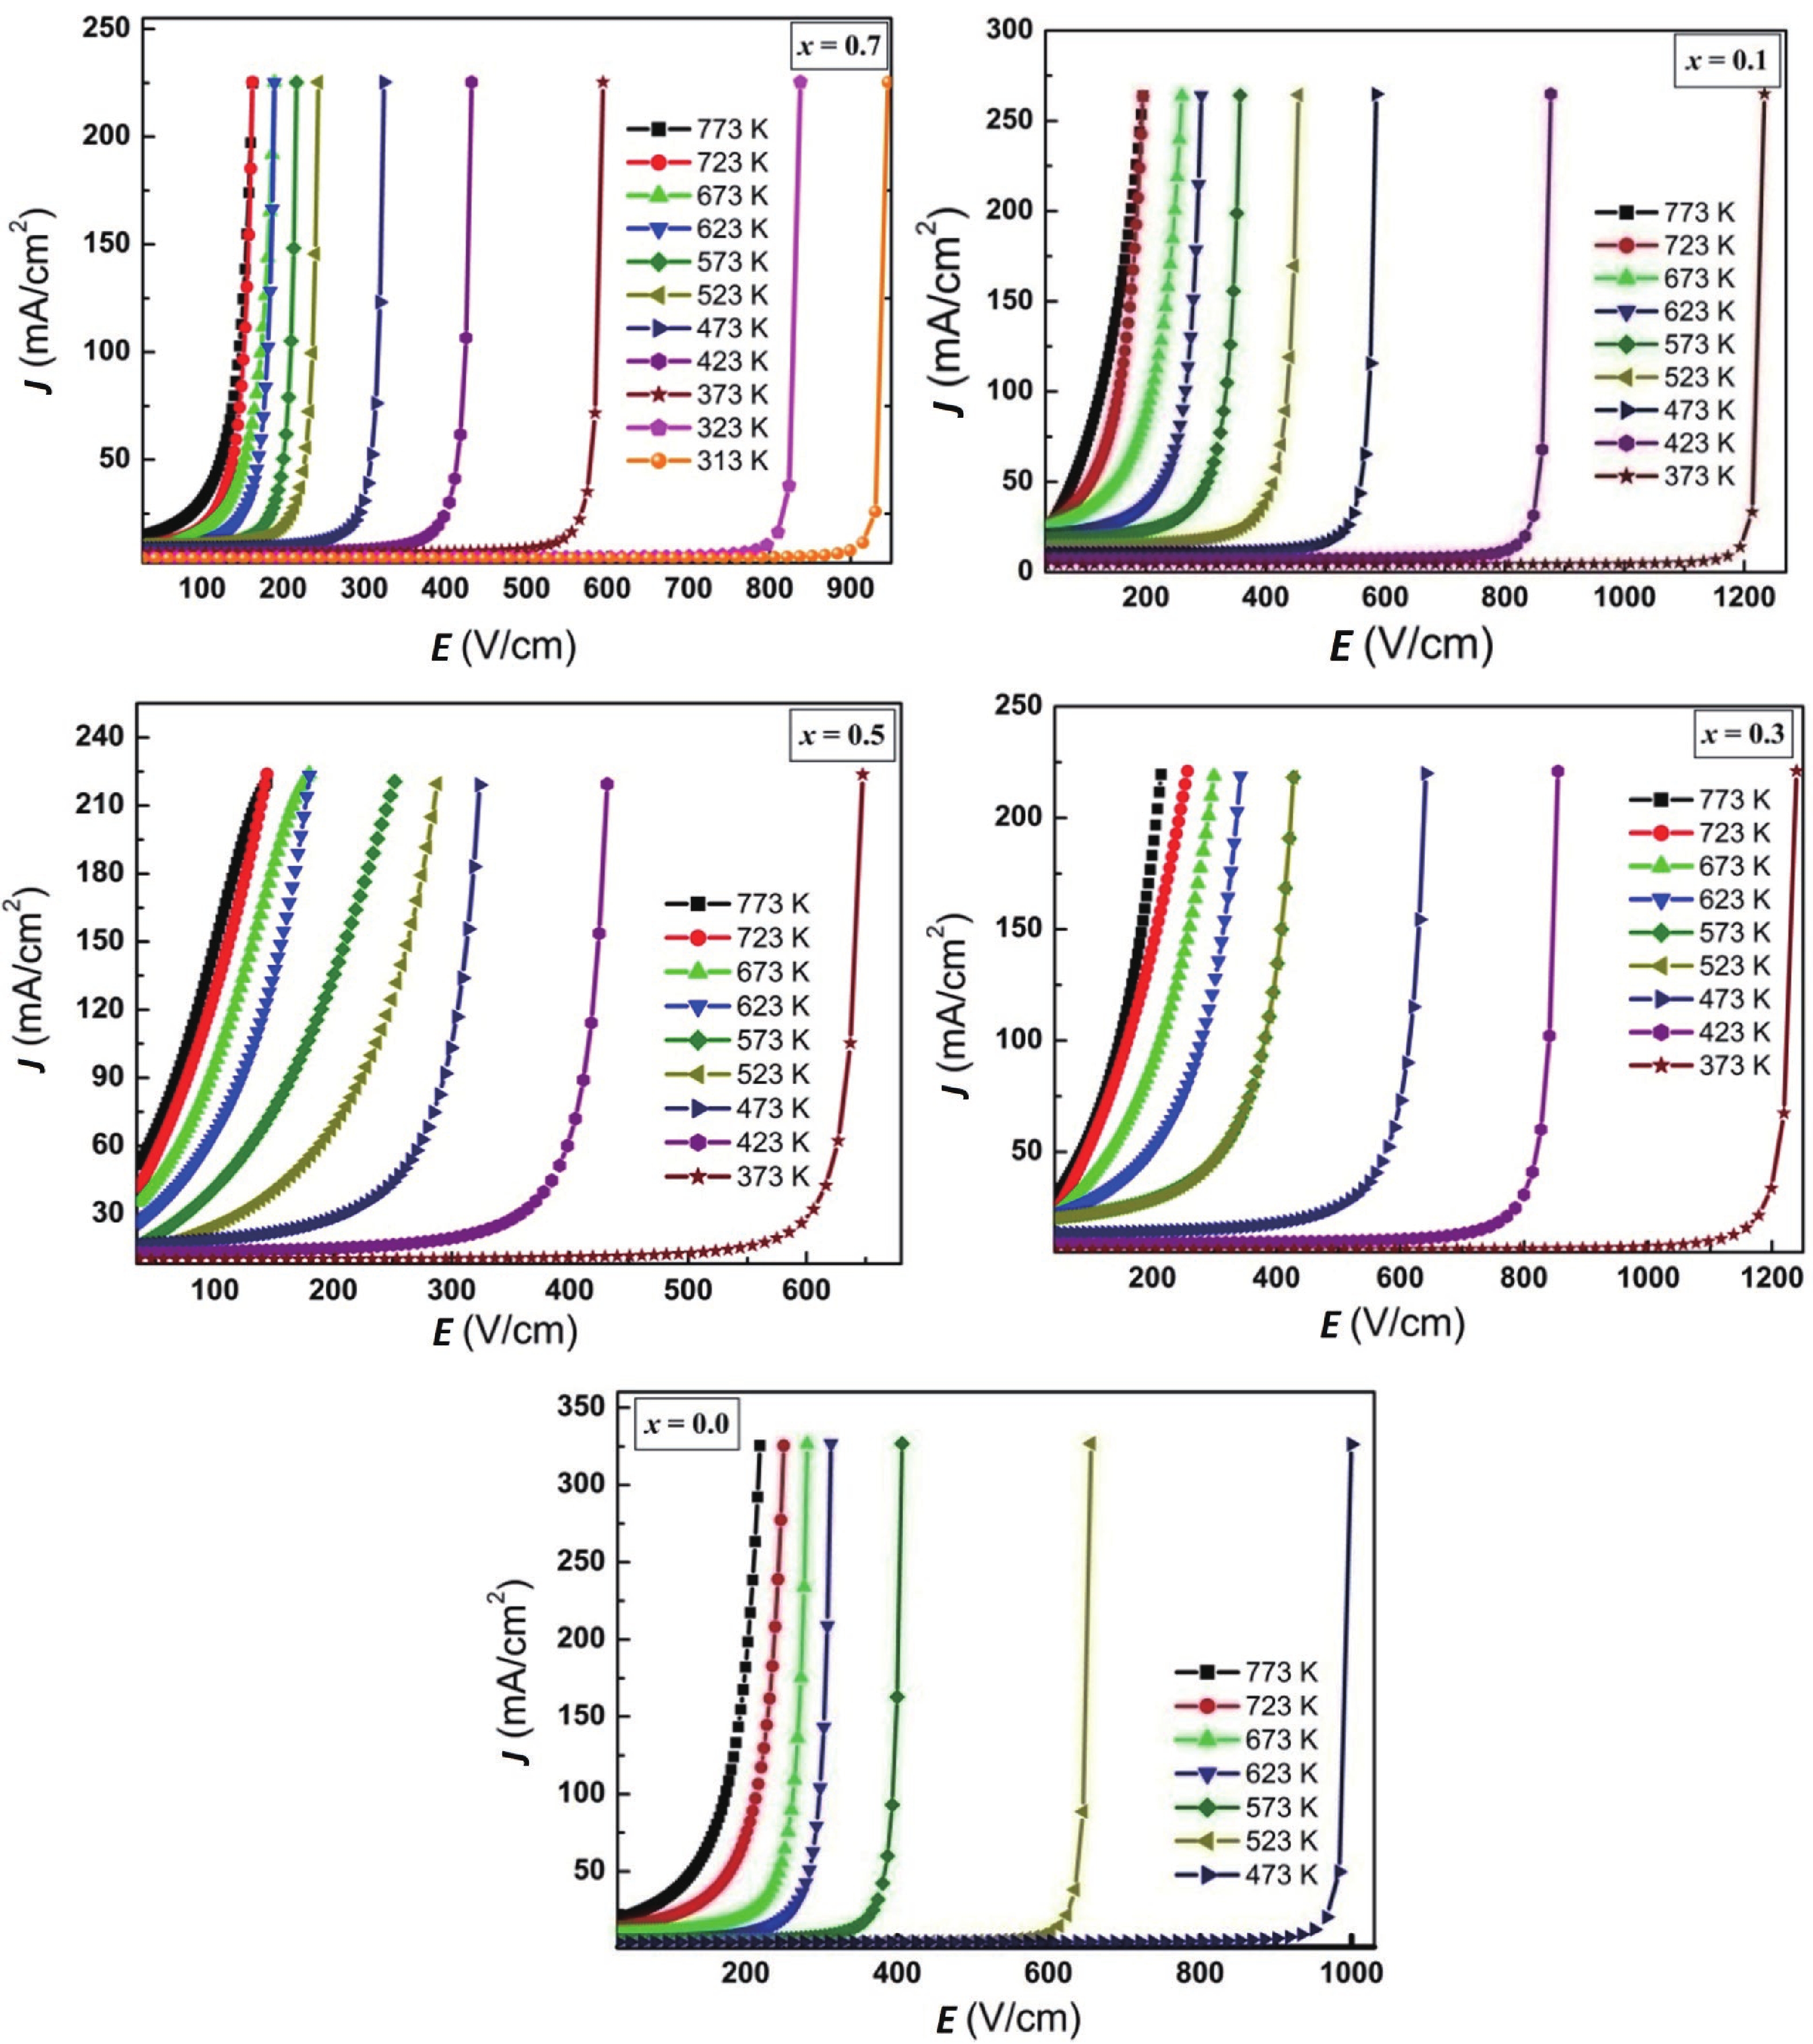
Kunal B. Modi1, Pooja Y. Raval2, Dolly J. Parekh1, Shrey K. Modi3, Niketa P. Joshi1, Akshay R. Makadiya1, Nimish H. Vasoya4, and Utpal S. Joshi5
Author Affiliations
  • 1Department of Physics, Saurashtra University, Rajkot 360005, India
  • 2Department of Physics, C. U. Shah University, Wadhwan City, Surendranagar 363030, India
  • 3Department of Environment Engineering, L. D. Engineering College, Ahmedabad 380015, India
  • 4Department of Balbhavan, Children´s University, Sector – 20, Gandhinagar 382015, India
  • 5Department of Physics, University School of Sciences, Gujarat University, Ahmedabad 380009, India
  • show less
    DOI: 10.1088/1674-4926/43/3/032001 Cite this Article
    Kunal B. Modi, Pooja Y. Raval, Dolly J. Parekh, Shrey K. Modi, Niketa P. Joshi, Akshay R. Makadiya, Nimish H. Vasoya, Utpal S. Joshi. Fe3+-substitution effect on the thermal variation of J–E characteristics and DC resistivity of quadruple perovskite CaCu3Ti4O12[J]. Journal of Semiconductors, 2022, 43(3): 032001 Copy Citation Text show less
    (Color online) Plots of J–E characteristic recorded at different temperatures for a series of cubic perovskites, CaCu3–xTi4–xFe2xO12 (x = 0.0–0.7).
    Fig. 1. (Color online) Plots of JE characteristic recorded at different temperatures for a series of cubic perovskites, CaCu3–xTi4–xFe2xO12 (x = 0.0–0.7).
    Williamson-Hall plots for all the samples of a series CaCu3–xTi4–xFe2xO12.
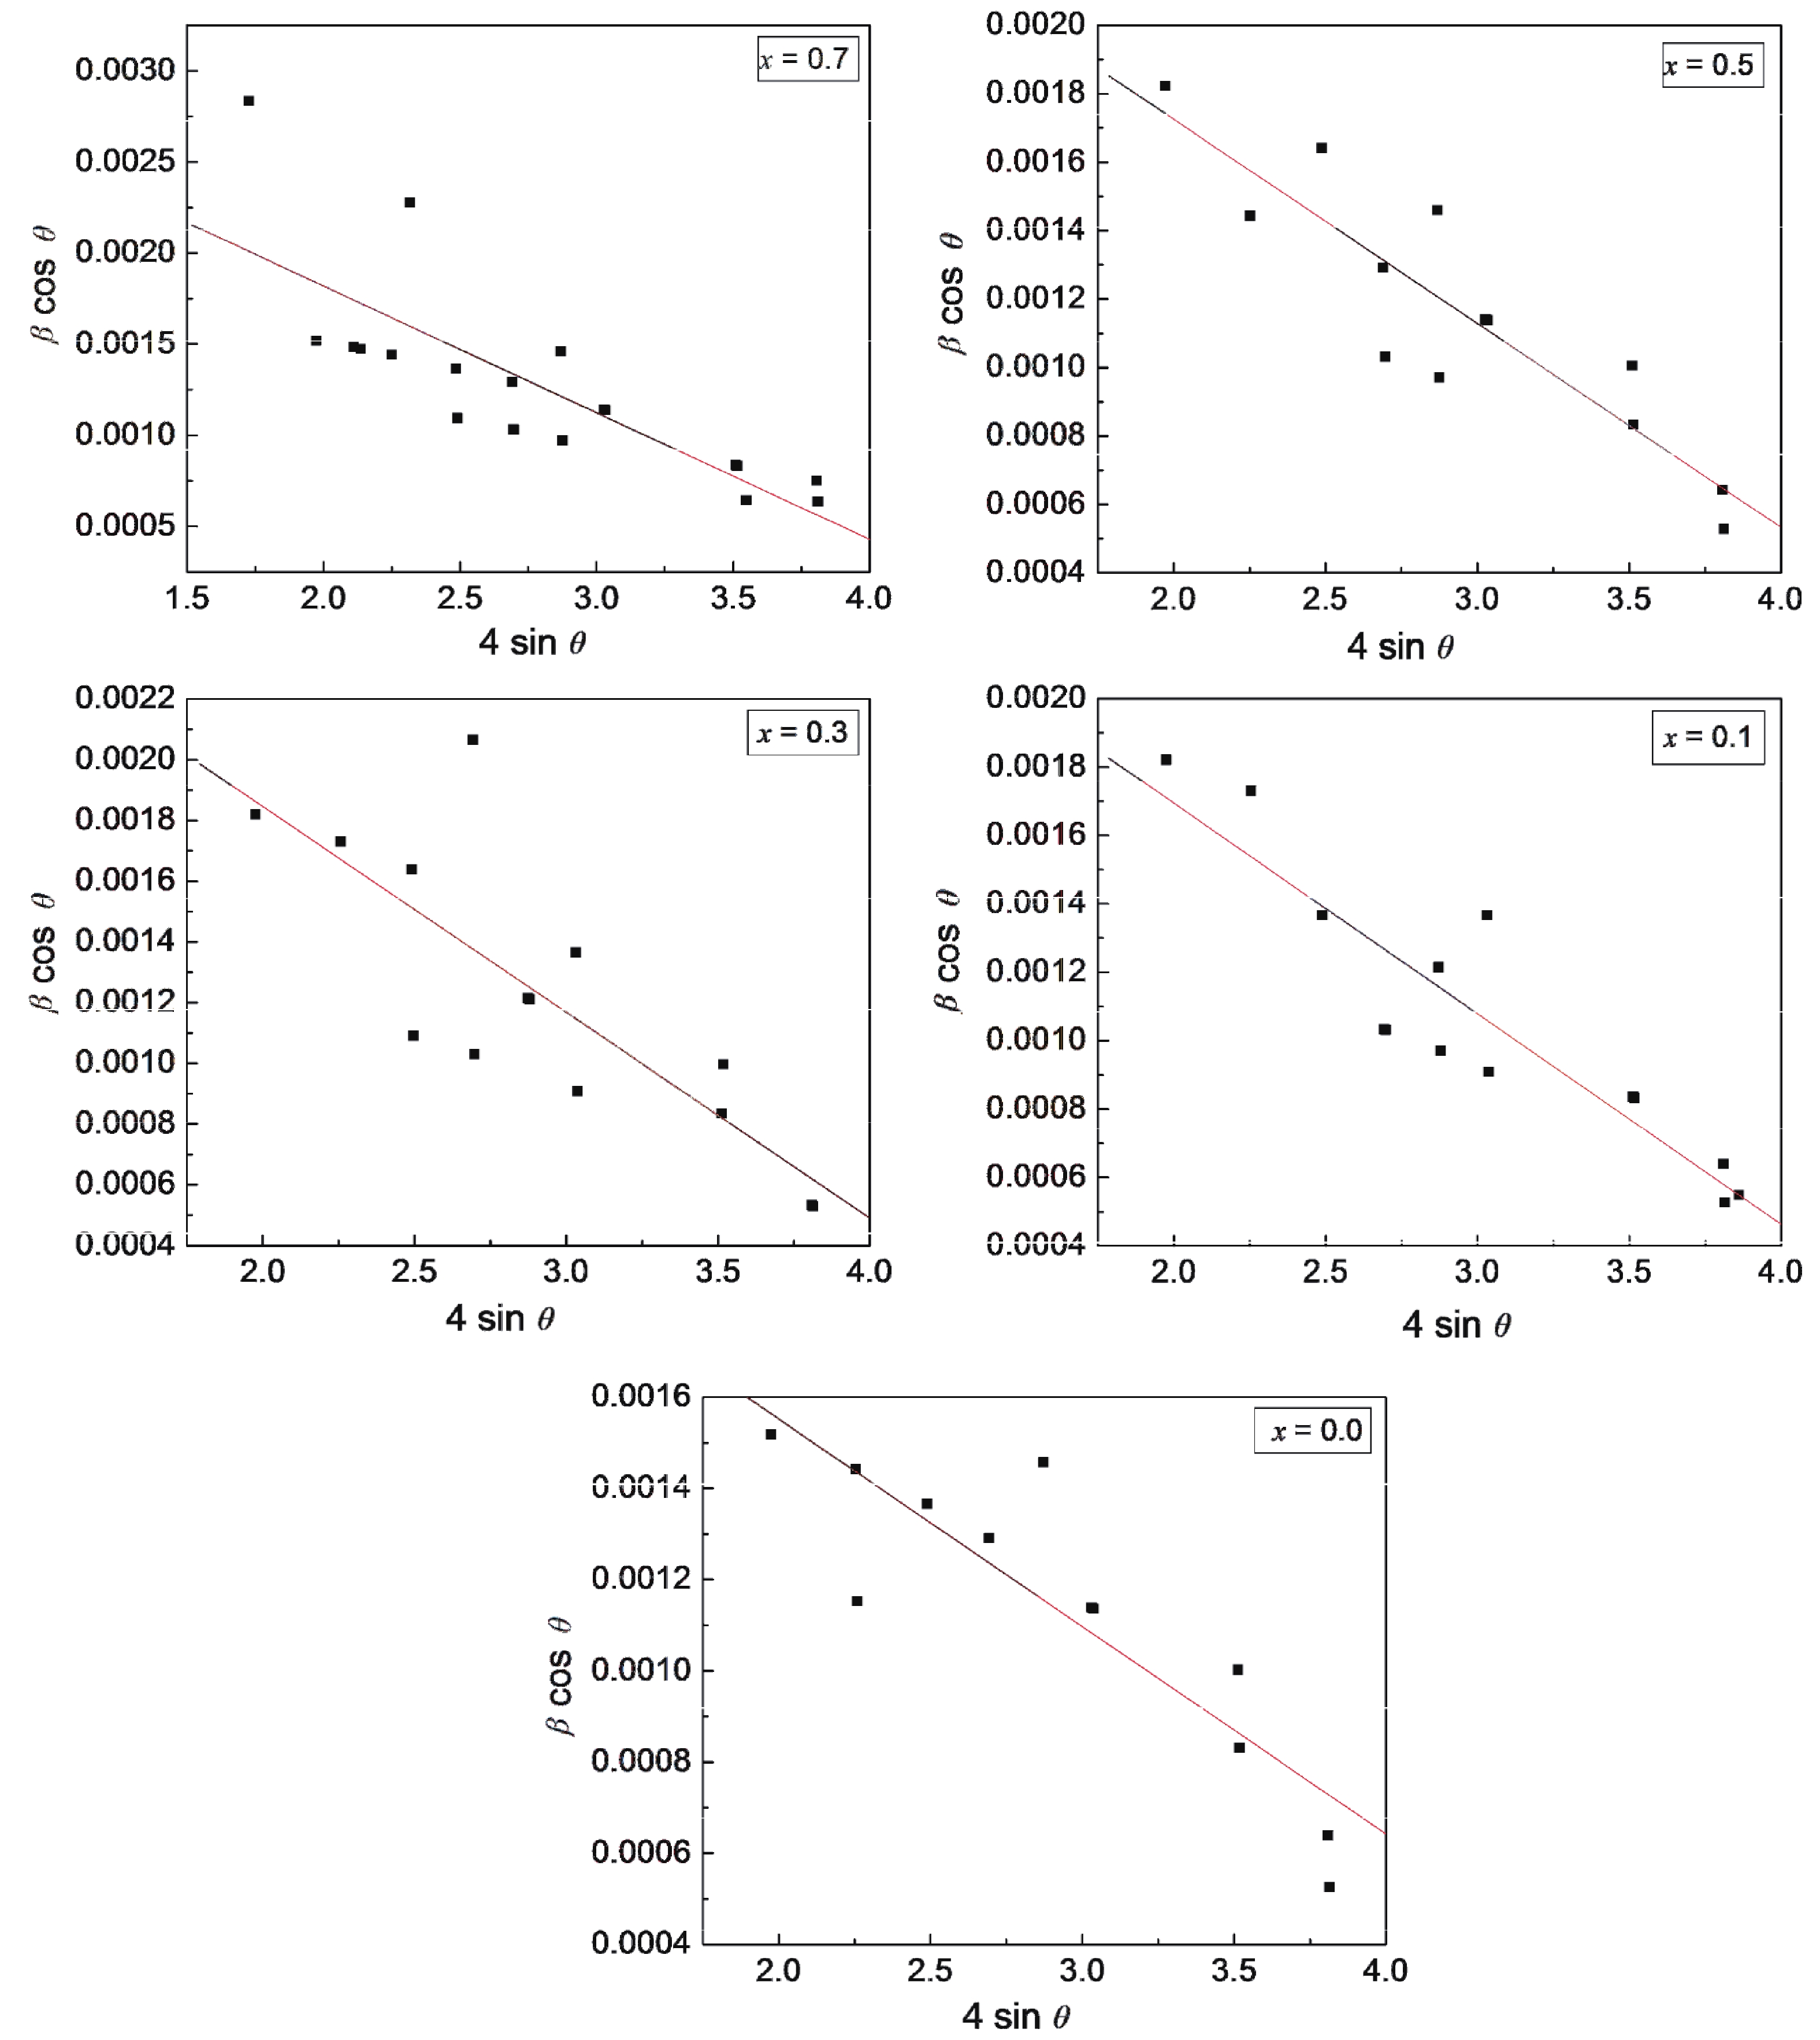
    Fig. 2. Williamson-Hall plots for all the samples of a series CaCu3–xTi4–xFe2xO12.
    (Color online) ln J against E1/2 plots at different temperatures for polycrystalline samples of quadruple perovskite series, CaCu3–xTi4–xFe2xO12.
    Fig. 3. (Color online) ln J against E1/2 plots at different temperatures for polycrystalline samples of quadruple perovskite series, CaCu3–xTi4–xFe2xO12.
    (Color online) Plots of ln Jo against temperature for the different compositions.
    Fig. 4. (Color online) Plots of ln Jo against temperature for the different compositions.
    (Color online) Arrhenius plots for a quadruple perovskite series, CaCu3–xTi4–xFe2x O12.
    Fig. 5. (Color online) Arrhenius plots for a quadruple perovskite series, CaCu3–xTi4–xFe2x O12.
    Fe3+_ content (x) Strain 10–4a (Å) ±0.002 Å dx (g/cm3) d (g/cm3) fD (μm) δ (1010m–2) TsL (K) Es (V/cm) T = 473 K Jmax (mA/cm2) Ea1 (eV) Ea2 (eV)
    TsL is the lowest temperature at which switching action takes place.Es is the threshold value of the electric field beyond which non-ohmic behavior is observed. Jmax is the maximum current density value. Ea1 and Ea2 are the activation energies determined from Arrhenius plots below and above the transition temperature, respectively.
    0.0–4.547.3915.0564.7440.0623.77.304739783270.330.43
    0.1–6.167.3885.0614.7120.0693735702700.290.29
    0.3–6.777.3875.0644.7040.0717.51.783735252250.220.21
    0.5–5.967.4005.0384.5560.0967.91.603732612250.250.15
    0.7–6.957.4115.0164.5660.0903.48.653733002250.270.21
    Table 1. Structural, microstructural, and electric parameters for a series of cubic perovskites.
    Fe3+ content (x) Cation distribution
    0.0[ ] { }
    0.1[ ] { }
    0.3[ ] { }
    0.5[ ] { }
    0.7[ ] { }
    Table 2. Distribution of metallic cations (Ca+2, Cu+2, Ti+4 and Fe+3) among the available crystallographic sites determined from Rietvield refinement of X-ray powder diffraction data ( T = 300 K) for CaCu3–xTi4Fe2xO12 ( x = 0.0–0.7) system.
    Kunal B. Modi, Pooja Y. Raval, Dolly J. Parekh, Shrey K. Modi, Niketa P. Joshi, Akshay R. Makadiya, Nimish H. Vasoya, Utpal S. Joshi. Fe3+-substitution effect on the thermal variation of J–E characteristics and DC resistivity of quadruple perovskite CaCu3Ti4O12[J]. Journal of Semiconductors, 2022, 43(3): 032001
    Download Citation