• Acta Optica Sinica
  • Vol. 43, Issue 7, 0727001 (2023)
Wei Li1、*, Zhixue Wu1、2, Qingwei Wang1, Ruixin Li1, Qinghui Li1, Mingjian Ju1, Zichao Gao1, Xin Shang1, Long Tian1、3、**, and Yaohui Zheng1、3
Author Affiliations
  • 1State Key Laboratory of Quantum Optics and Quantum Optics Devices, Institute of Opto-Electronics, Shanxi University, Taiyuan 030006, Shanxi, China
  • 2College of Physics and Electronic Engineering, Shanxi University, Taiyuan 030006, Shanxi, China
  • 3Collaborative Innovation Center of Extreme Optics, Shanxi University, Taiyuan 030006, Shanxi, China
  • show less
    DOI: 10.3788/AOS221918 Cite this Article Set citation alerts
    Wei Li, Zhixue Wu, Qingwei Wang, Ruixin Li, Qinghui Li, Mingjian Ju, Zichao Gao, Xin Shang, Long Tian, Yaohui Zheng. Integrated Resonant Photodetector with High Signal-to-Noise Ratio[J]. Acta Optica Sinica, 2023, 43(7): 0727001 Copy Citation Text show less
    Block diagram of resonance frequency measurement of RPD
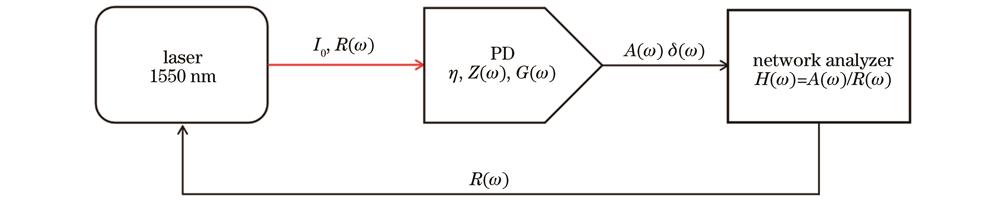
    Fig. 1. Block diagram of resonance frequency measurement of RPD
    Layout of the LC resonant circuit and its equivalent circuit. (a) LC resonant circuit; (b) equivalent circuit
    Fig. 2. Layout of the LC resonant circuit and its equivalent circuit. (a) LC resonant circuit; (b) equivalent circuit
    Circuit diagram of resonant photodetector
    Fig. 3. Circuit diagram of resonant photodetector
    Experimental device for measuring the transfer function of photodetector and error signal for servo control system
    Fig. 4. Experimental device for measuring the transfer function of photodetector and error signal for servo control system
    Gain comparison of BPD and RPD that has a resonant frequency of 20 MHz and a 3 dB bandwidth of 0.285 MHz
    Fig. 5. Gain comparison of BPD and RPD that has a resonant frequency of 20 MHz and a 3 dB bandwidth of 0.285 MHz
    Comparison of error signals for cavity-locking of RPD and BPD. (a) RPD; (b) BPD
    Fig. 6. Comparison of error signals for cavity-locking of RPD and BPD. (a) RPD; (b) BPD
    Comparison of signal-to-noise ratio of BPD and RPD error signals
    Fig. 7. Comparison of signal-to-noise ratio of BPD and RPD error signals
    Ref.Wavelength /nmCentral frequency /MHzQSNR /dB
    29800-170058.697.6
    30860500~2912
    351064-1550156
    Proposed1064-1550207022.5
    Table 1. Performance comparison of resonant structure detection systems
    Wei Li, Zhixue Wu, Qingwei Wang, Ruixin Li, Qinghui Li, Mingjian Ju, Zichao Gao, Xin Shang, Long Tian, Yaohui Zheng. Integrated Resonant Photodetector with High Signal-to-Noise Ratio[J]. Acta Optica Sinica, 2023, 43(7): 0727001
    Download Citation