• Opto-Electronic Advances
  • Vol. 4, Issue 3, 200077-1 (2021)
Anir S. Sharbirin, Sophia Akhtar, and Jeongyong Kim*
Author Affiliations
  • Department of Energy Science, Sungkyunkwan University, Suwon 16419, Republic of Korea.
  • show less
    DOI: 10.29026/oea.2021.200077 Cite this Article
    Anir S. Sharbirin, Sophia Akhtar, Jeongyong Kim. Light-emitting MXene quantum dots[J]. Opto-Electronic Advances, 2021, 4(3): 200077-1 Copy Citation Text show less
    Top-down approaches for MQD synthesis.
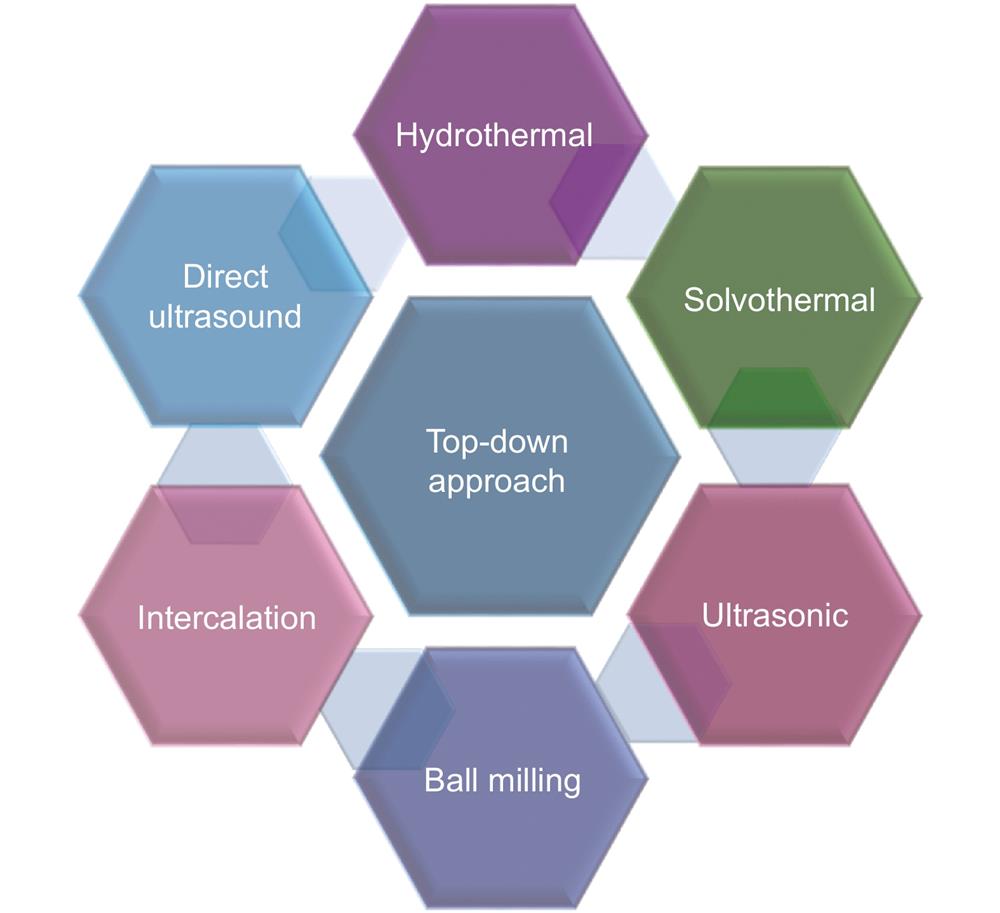
    Fig. 1. Top-down approaches for MQD synthesis.
    Hydrothermal and solvothermal synthesis processes. The figures were reproduced with permission from: (a) ref.29, Copyright 2017, John Wiley and Sons; (b) ref.68, Copyright 2019, Elsevier; (c) ref.70, Copyright 2018, John Wiley and Sons.
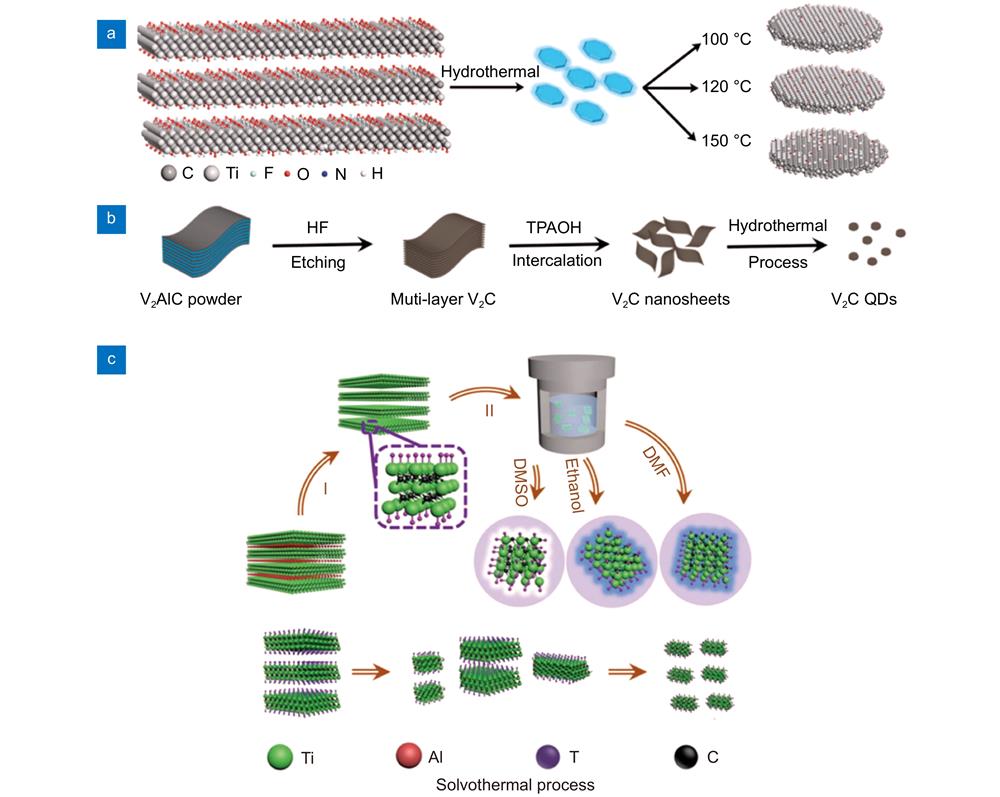
    Fig. 2. Hydrothermal and solvothermal synthesis processes. The figures were reproduced with permission from: (a) ref.29, Copyright 2017, John Wiley and Sons; (b) ref.68, Copyright 2019, Elsevier; (c) ref.70, Copyright 2018, John Wiley and Sons.
    Solvothermal/hydrothermal-ultrasound synthesis process. The figure was reproduced from: ref.66, Copyright 2019, American Chemical Society.
    Fig. 3. Solvothermal/hydrothermal-ultrasound synthesis process. The figure was reproduced from: ref.66, Copyright 2019, American Chemical Society.
    Ultrasonic, ball milling, and intercalation synthesis methods. The figures were reproduced from: (a) ref.33, Copyright 2017, American Chemical Society; (b) ref.80, Copyright 2018, under a Creative Commons Attribution lisence; (c) ref.81, Copyright 2018, Wiley-VCH.
    Fig. 4. Ultrasonic, ball milling, and intercalation synthesis methods. The figures were reproduced from: (a) ref.33, Copyright 2017, American Chemical Society; (b) ref.80, Copyright 2018, under a Creative Commons Attribution lisence; (c) ref.81, Copyright 2018, Wiley-VCH.
    Types of bottom-up synthesis processes. The figures were reproduced from: (a) ref.82. Copyright 2018, John Wiley and Sons; (b) ref.83, Copyright 2018, American Chemical Society.
    Fig. 5. Types of bottom-up synthesis processes. The figures were reproduced from: (a) ref.82. Copyright 2018, John Wiley and Sons; (b) ref.83, Copyright 2018, American Chemical Society.
    (a) MQD preparation by the hydrothermal method. TEM and HRTEM images of (b,e) MQD-100, (c,f) MQD-120, and (d,g) MQD-150. UV–vis spectra, PLE, and PL of (h) MQD-100, (i) MQD-120, and (j) MQD-150 in aqueous solutions. The figures were reproduced with permission from ref.29, Copyright 2017, John Wiley and Sons.
    Fig. 6. (a) MQD preparation by the hydrothermal method. TEM and HRTEM images of (b,e) MQD-100, (c,f) MQD-120, and (d,g) MQD-150. UV–vis spectra, PLE, and PL of (h) MQD-100, (i) MQD-120, and (j) MQD-150 in aqueous solutions. The figures were reproduced with permission from ref.29, Copyright 2017, John Wiley and Sons.
    DFT calculation of total and projected density of states of (a) Ti3C2O2 QDs and (b) Ti3C2-xNxO2 QDs. (c) Work function of pristine Ti3C2 QDs (MQDs) and N-MQDs. Figures were reproduced with permission from ref.34. Copyright 2018, Royal Society of Chemistry.
    Fig. 7. DFT calculation of total and projected density of states of (a) Ti3C2O2 QDs and (b) Ti3C2-xNxO2 QDs. (c) Work function of pristine Ti3C2 QDs (MQDs) and N-MQDs. Figures were reproduced with permission from ref.34. Copyright 2018, Royal Society of Chemistry.
    (a) Schematic of the molecular interactions and light-emitting mechanism of MQDs in water. (b) The corresponding HRTEM image of SN-MQDs in relation to the mechanism. (c) DLS size distributions of the synthesized MQDs in deionized water. Figures were reproduced with permission from ref.30. Copyright 2019, Elsevier.
    Fig. 8. (a) Schematic of the molecular interactions and light-emitting mechanism of MQDs in water. (b) The corresponding HRTEM image of SN-MQDs in relation to the mechanism. (c) DLS size distributions of the synthesized MQDs in deionized water. Figures were reproduced with permission from ref.30. Copyright 2019, Elsevier.
    (a) White emission of Ti3C2. (b) PL color of the V2C QDs under different excitation wavelengths. (c) V2C MQDs colloid under 355 nm pulsed laser pumping. (d) Emission spectrum of white LED (e) Chromaticity diagram (CIE 1931) coordinates of the white LED (0.30, 0.34). Figures were reproduced with from: (a), (d), (e) ref.36. Copyright 2019, WILEY-VCH; (b), (c) ref.37. Copyright 2019, John Wiley and Sons.
    Fig. 9. (a) White emission of Ti3C2. (b) PL color of the V2C QDs under different excitation wavelengths. (c) V2C MQDs colloid under 355 nm pulsed laser pumping. (d) Emission spectrum of white LED (e) Chromaticity diagram (CIE 1931) coordinates of the white LED (0.30, 0.34). Figures were reproduced with from: (a), (d), (e) ref.36. Copyright 2019, WILEY-VCH; (b), (c) ref.37. Copyright 2019, John Wiley and Sons.
    (a) The normalized fluorescence intensity of MQDs at 380 nm in the presence of various analytes. (b) The MQD synthesis process and working principle for Fe3+ sensing. (c) Normalized PL spectra of [Ru(dpp)3]Cl2 and Ti3C2 QDs in a buffer solution with different pH values (λex = 350 nm). (d) The principle of Ti3C2 QD-based fluorescence assay for ALP activity. The figures were reproduced with permission from: (a), (b) ref.109, (c) ref.94 and (d) ref.112, Royal Society of Chemistry.
    Fig. 10. (a) The normalized fluorescence intensity of MQDs at 380 nm in the presence of various analytes. (b) The MQD synthesis process and working principle for Fe3+ sensing. (c) Normalized PL spectra of [Ru(dpp)3]Cl2 and Ti3C2 QDs in a buffer solution with different pH values (λex = 350 nm). (d) The principle of Ti3C2 QD-based fluorescence assay for ALP activity. The figures were reproduced with permission from: (a), (b) ref.109, (c) ref.94 and (d) ref.112, Royal Society of Chemistry.
    (a) Bright-field imaging of RAW264.7 cells and confocal imaging of RAW264.7 cells incubated with MQD-100 at 405 nm, 488 nm, and 543 nm excitation. (b),(c) Fluorescent imaging (Ex = 488 nm) of the THP-1 monocytes incubated (b) with N,P-MQDs (c) without N,P-MQDs (d) CLSM images of MCF-7 and NHDF cells after incubation of V2C-TAT@Ex or V2C-TAT@Ex-RGD (Scale bar: 40 μm). The figures were reproduced with permission from: (a) ref.29. Copyright 2017, John Wiley and Sons; (b),(c) ref.110. Copyright 2019, Royal Society of Chemistry; (d) ref.68. Copyright 2019, American Chemical Society.
    Fig. 11. (a) Bright-field imaging of RAW264.7 cells and confocal imaging of RAW264.7 cells incubated with MQD-100 at 405 nm, 488 nm, and 543 nm excitation. (b),(c) Fluorescent imaging (Ex = 488 nm) of the THP-1 monocytes incubated (b) with N,P-MQDs (c) without N,P-MQDs (d) CLSM images of MCF-7 and NHDF cells after incubation of V2C-TAT@Ex or V2C-TAT@Ex-RGD (Scale bar: 40 μm). The figures were reproduced with permission from: (a) ref.29. Copyright 2017, John Wiley and Sons; (b),(c) ref.110. Copyright 2019, Royal Society of Chemistry; (d) ref.68. Copyright 2019, American Chemical Society.
    MQDsSynthesis methodsPLQYRef (Year)
    Ti3C2Hydrothermal (pH = 9): 100 °C, 120 °C, 150 °C, 6 h10% (Blue)ref.29 (2017)
    Ultrasound (25% TMAOH): 24 h8.9% (Blue)ref.33 (2017)
    Hydrothermal (pH = 7, N-doped): 160 °C, 12 h18.7% (Blue)ref.34 (2018)
    Acid Reflux: 100 °C, 12 h, Hydrothermal: pH = 7, N-, P-doped120 °C, 12 h20.1% (Green)ref.35 (2019)
    Ultrasound: 600 W, 6 h, Solvothermal: 80 °C, 48 h9.36% (White)ref.36 (2019)
    Hydrothermal (pH = 7, S-,N-, SN-doped); 150 °C, 12 h28.12% (Blue), 8.33% (Yellow), 7.78% (Orange)ref.30 (2019)
    V2C Ultrasound: 1 h, Hydrothermal (alkaline): 120 °C, 6 h15.88% (Blue)ref.37 (2019)
    Nb2C Ultrasound (pH = 6, 60 ml TPAOH): 10 h8.4% (Bluish Green)ref.38 (2020)
    Table 1. Current progress on MQDs exhibiting photoluminescence
    Anir S. Sharbirin, Sophia Akhtar, Jeongyong Kim. Light-emitting MXene quantum dots[J]. Opto-Electronic Advances, 2021, 4(3): 200077-1
    Download Citation