• Laser & Optoelectronics Progress
  • Vol. 57, Issue 1, 011409 (2020)
Xiaohong Ge1、2, Ruiying Zhang2、*, Chunyang Guo2, Annan Li2, and Shuaida Wang2
Author Affiliations
  • 1Nano Science and Technology Institute, University of Science and Technology of China, Suzhou, Jiangsu 215123, China
  • 2Lightweight Laboratory of Advanced Materials Division, Suzhou Institute of Nano-Tech and Nano-Bionics, Chinese Academy of Sciences, Suzhou, Jiangsu 215123, China
  • show less
    DOI: 10.3788/LOP57.011409 Cite this Article Set citation alerts
    Xiaohong Ge, Ruiying Zhang, Chunyang Guo, Annan Li, Shuaida Wang. Multiple Factor Ion Implantation-Induced Quantum Well Intermixing Effect[J]. Laser & Optoelectronics Progress, 2020, 57(1): 011409 Copy Citation Text show less
    Distributions of P+ implantation depth under different implantation energies. (a) Samples of group A; (b) samples of group B
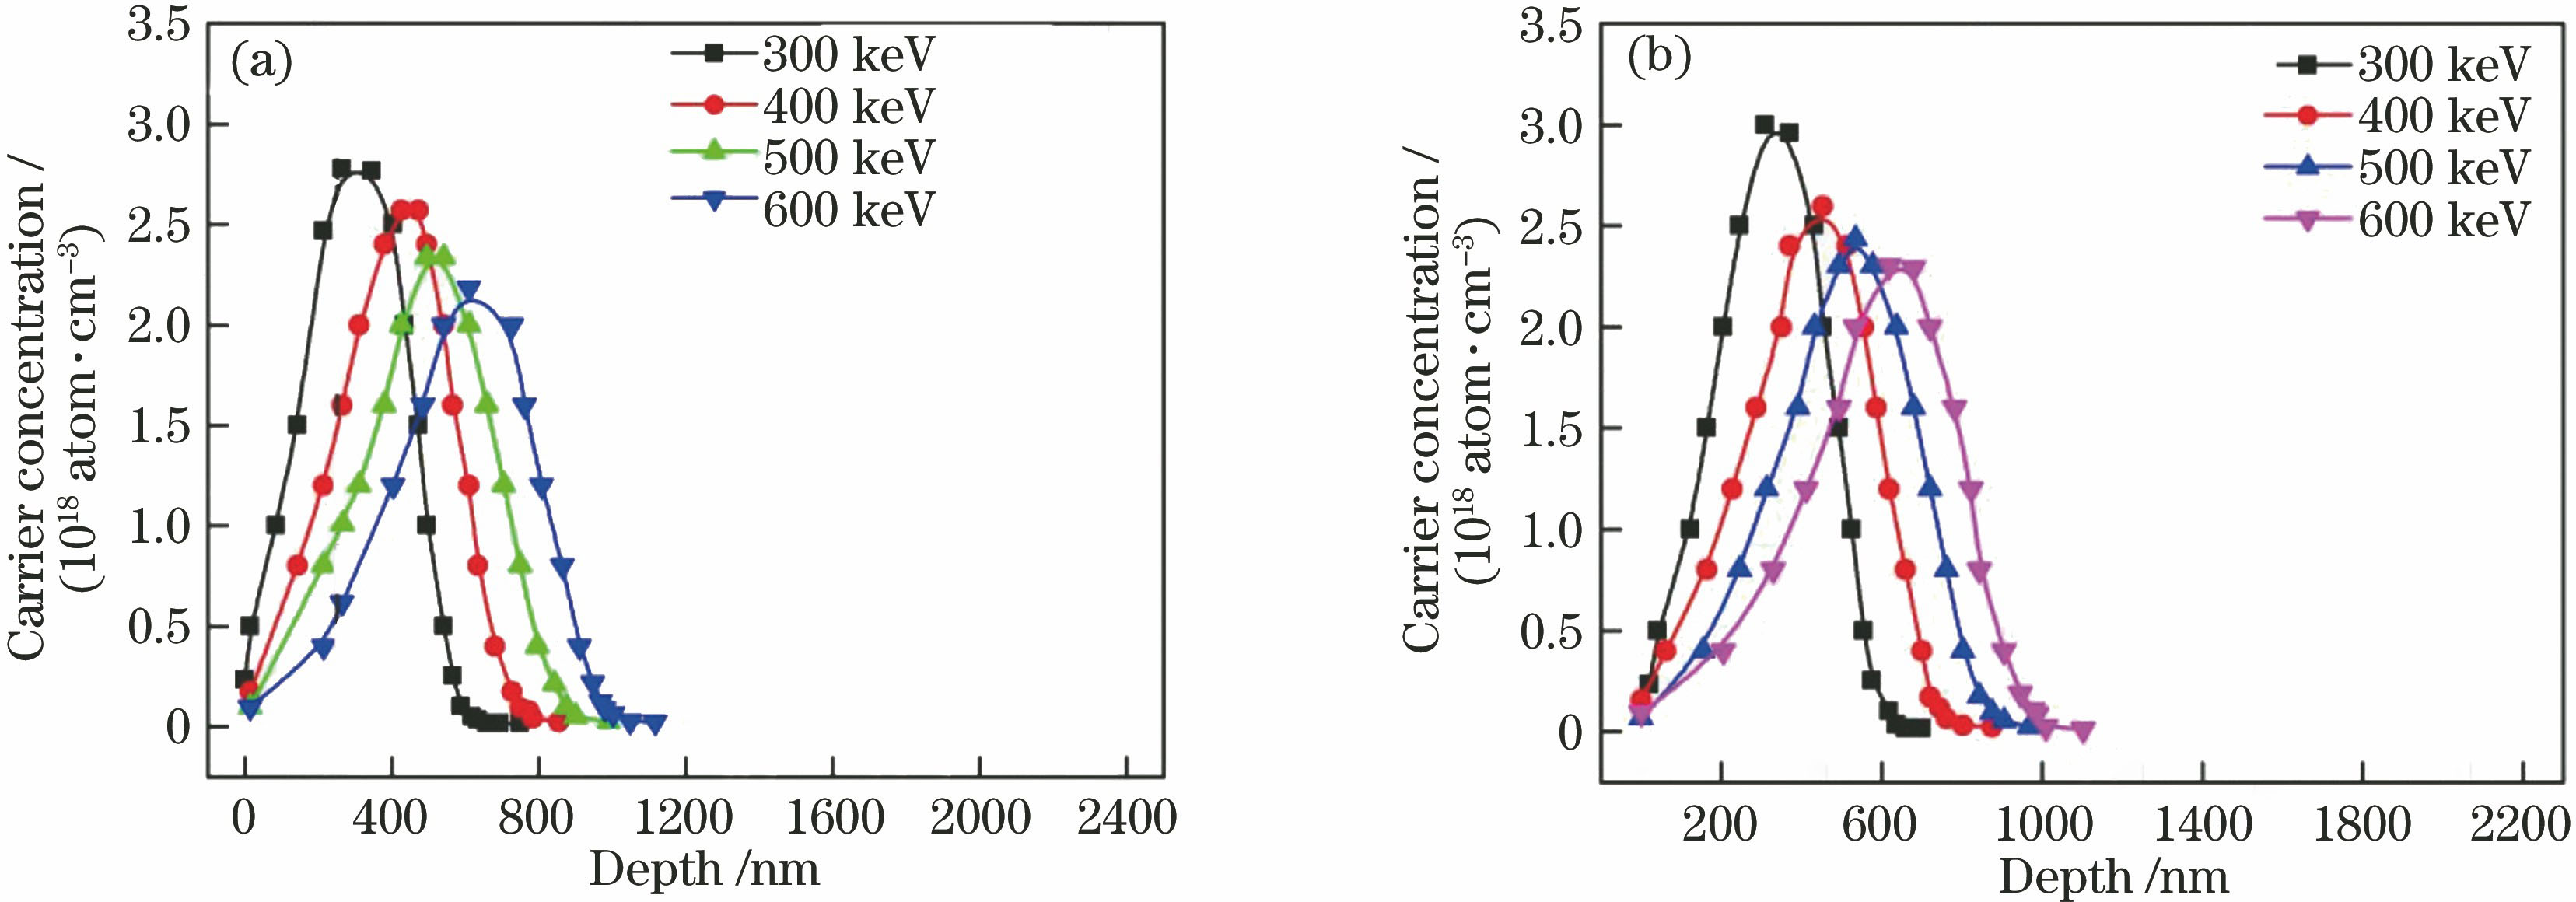
    Fig. 1. Distributions of P+ implantation depth under different implantation energies. (a) Samples of group A; (b) samples of group B
    Section views of epitaxial material. (a) Epitaxial wafer structure without etch, samples of group A; (b) epitaxial wafer structure for etching InGaAs contact layer and 600 nm InP cladding layer, samples of group B
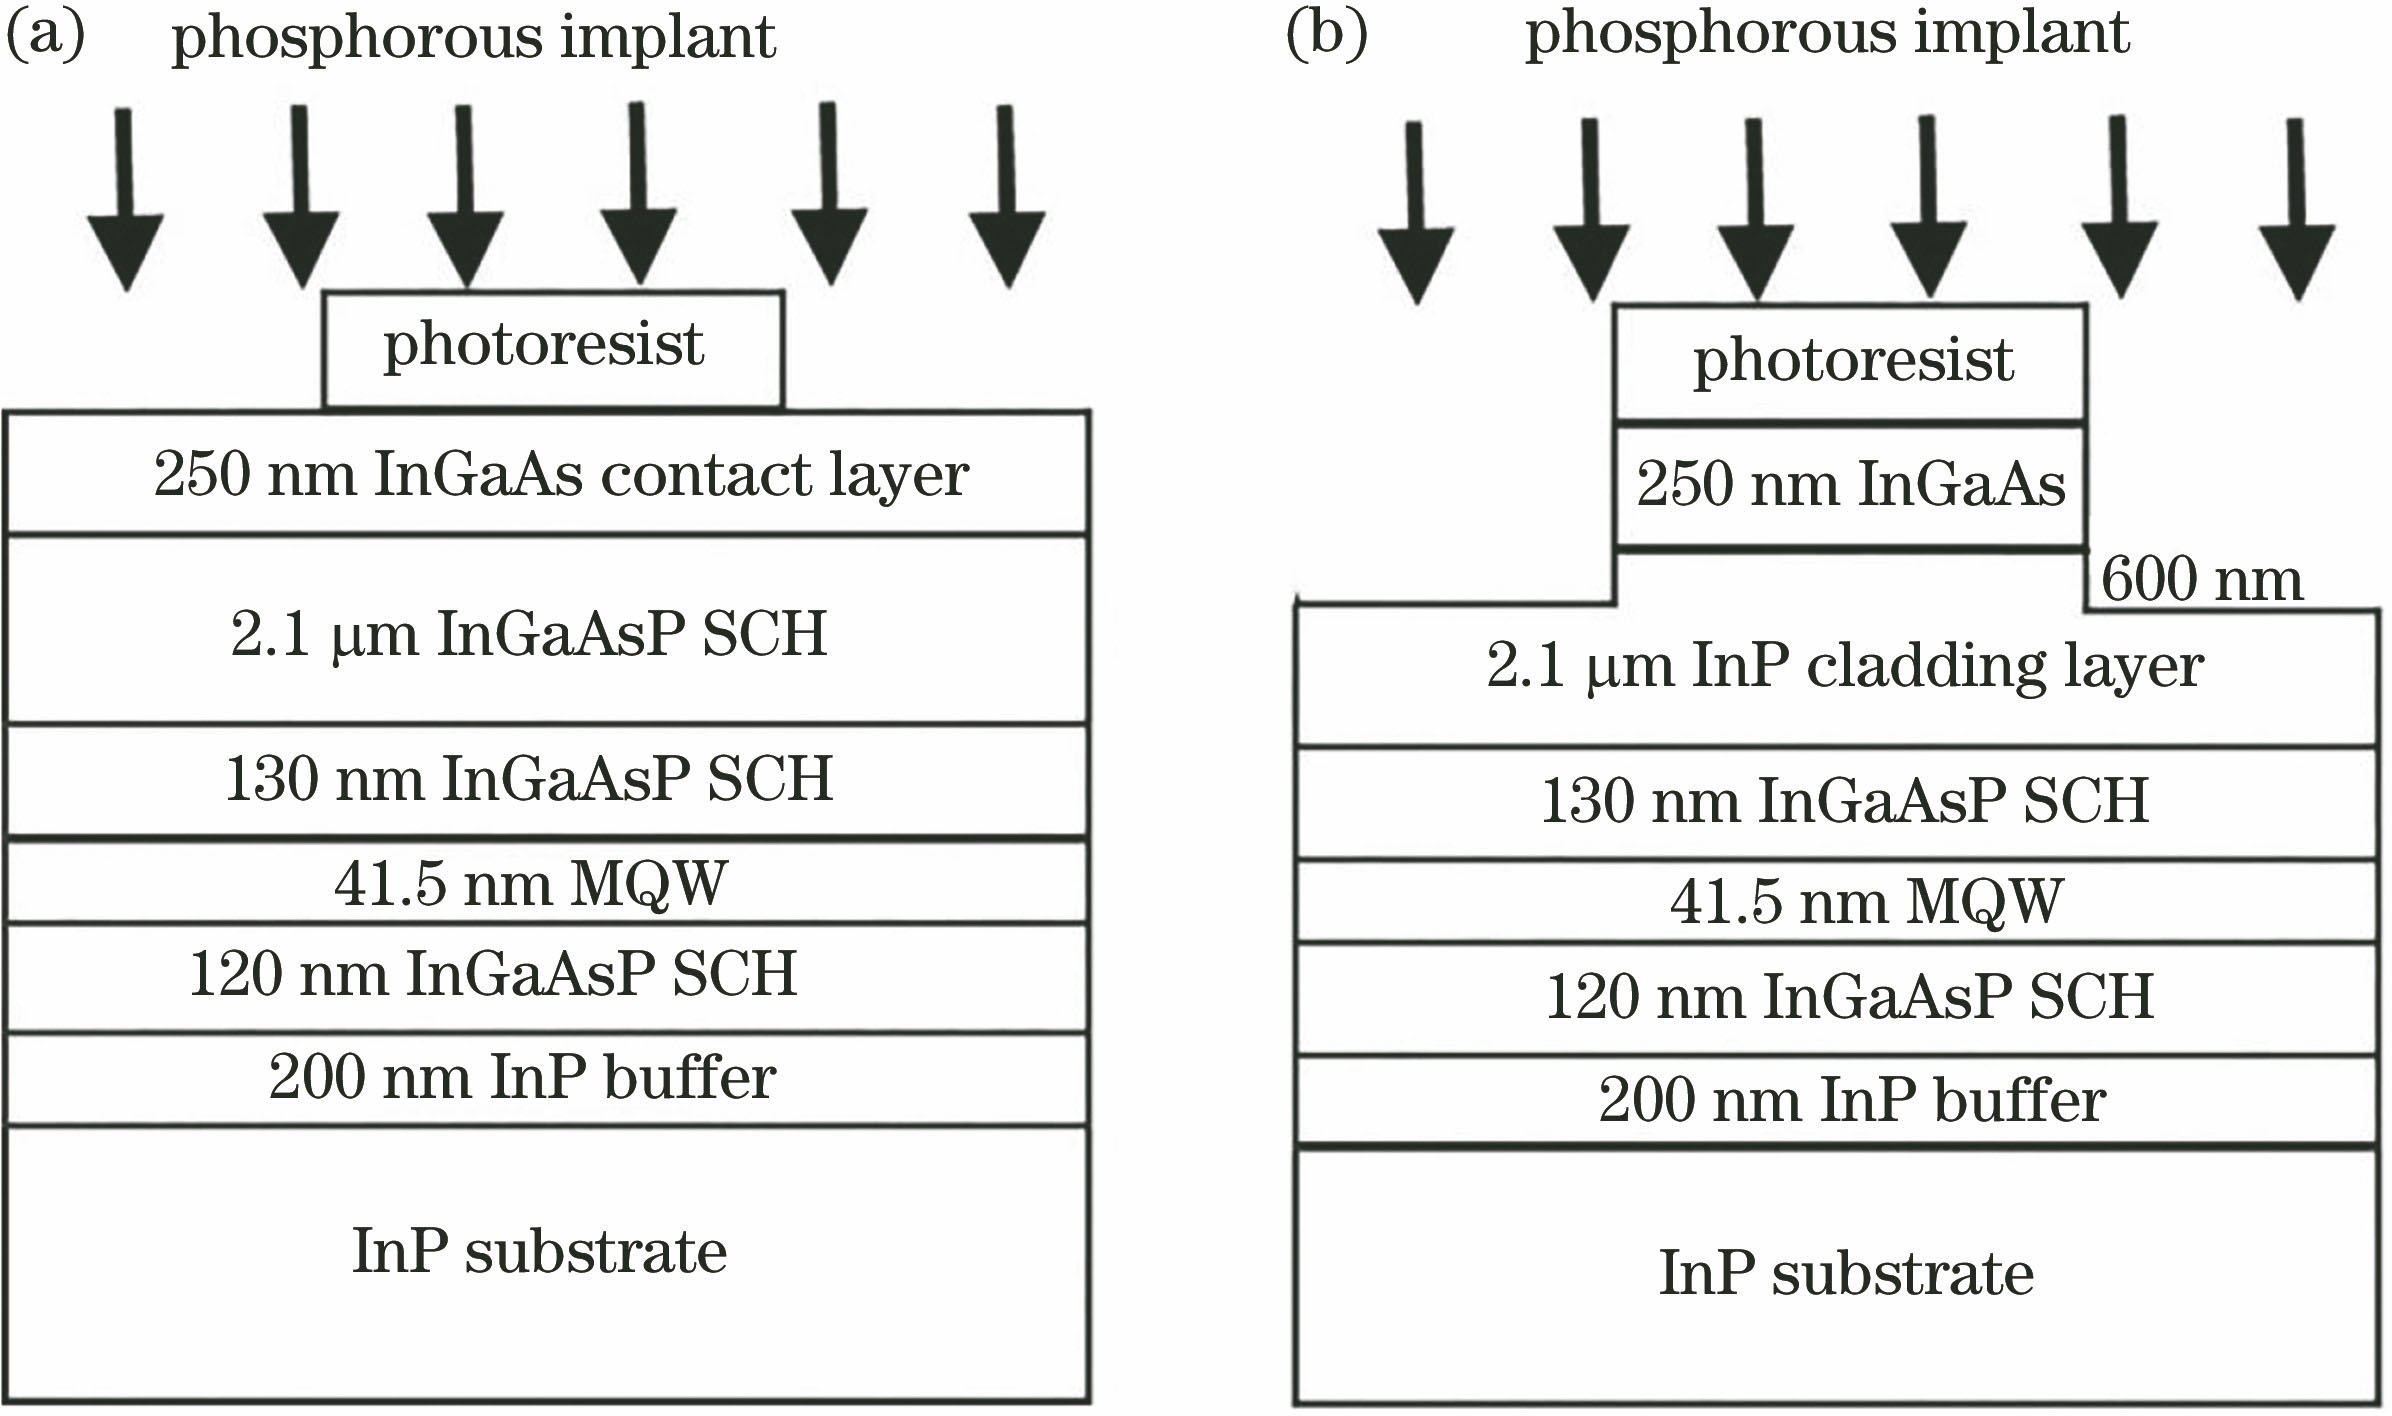
    Fig. 2. Section views of epitaxial material. (a) Epitaxial wafer structure without etch, samples of group A; (b) epitaxial wafer structure for etching InGaAs contact layer and 600 nm InP cladding layer, samples of group B
    Process flow charts of two groups of samples. (a) Group A; (b) group B
    Fig. 3. Process flow charts of two groups of samples. (a) Group A; (b) group B
    Blue-shift wavelength of sample A as a function of annealing temperature under different implantation energies
    Fig. 4. Blue-shift wavelength of sample A as a function of annealing temperature under different implantation energies
    Variation in blue-shift of wavelength at different annealing temperatures and time
    Fig. 5. Variation in blue-shift of wavelength at different annealing temperatures and time
    PL intensity of sample A as a function of annealing temperature under different implantation energies
    Fig. 6. PL intensity of sample A as a function of annealing temperature under different implantation energies
    Variation in PL intensity of sample A at different annealing temperatures and time
    Fig. 7. Variation in PL intensity of sample A at different annealing temperatures and time
    FWHM of sample A as a function of annealing temperature under different implantation energies
    Fig. 8. FWHM of sample A as a function of annealing temperature under different implantation energies
    Comparison of PL spectra between samples A and B
    Fig. 9. Comparison of PL spectra between samples A and B
    Xiaohong Ge, Ruiying Zhang, Chunyang Guo, Annan Li, Shuaida Wang. Multiple Factor Ion Implantation-Induced Quantum Well Intermixing Effect[J]. Laser & Optoelectronics Progress, 2020, 57(1): 011409
    Download Citation