• Laser & Optoelectronics Progress
  • Vol. 59, Issue 19, 1912002 (2022)
Xiaobo Cheng1、2, Yundong Zhu1、2、*, Xuezhu Lin1、2, Funing Liu1、2, and Linxin Yin1、2
Author Affiliations
  • 1School of Optoelectronic Engineering, Changchun University of Science and Technology,Changchun 130022, Jilin, China
  • 2National Demonstration Center for Experimental Opto-Electronic Engineering Education, School of Opto-Electronic Engineering, Changchun University of Science and Technology, Changchun 130022, Jilin, China
  • show less
    DOI: 10.3788/LOP202259.1912002 Cite this Article Set citation alerts
    Xiaobo Cheng, Yundong Zhu, Xuezhu Lin, Funing Liu, Linxin Yin. Recurrence of Laplace Deformation Surface Based on Optimized Control Point Monitoring[J]. Laser & Optoelectronics Progress, 2022, 59(19): 1912002 Copy Citation Text show less
    Flow chart of Laplace deformation
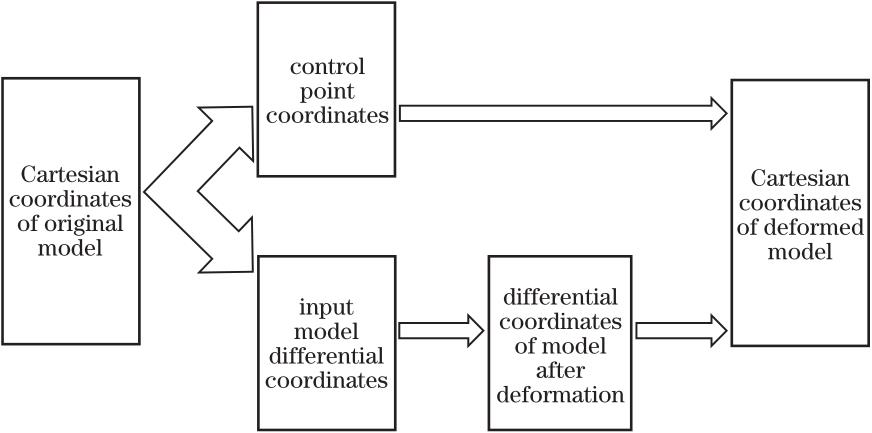
    Fig. 1. Flow chart of Laplace deformation
    Simplified models corresponding to different fixed ends. (a) Unilateral constraints; (b) adjacent constraint; (c) boundary constraints; (d) quadrilateral constraint; (e) trilateral constraints
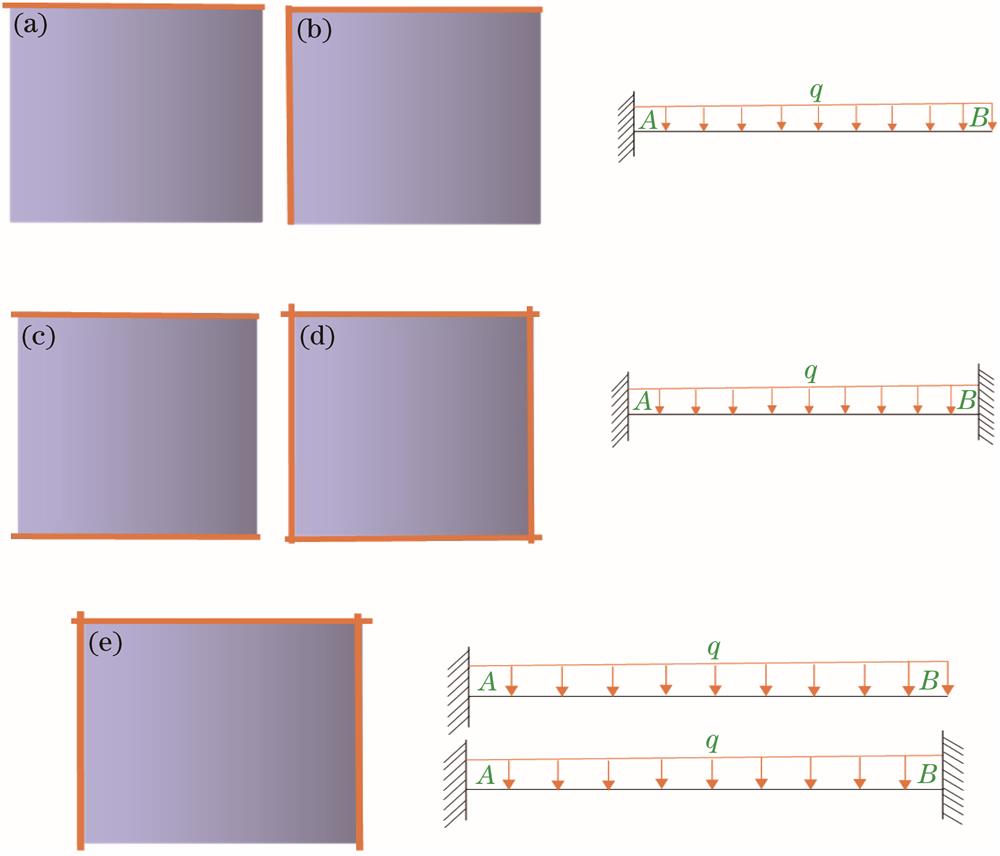
    Fig. 2. Simplified models corresponding to different fixed ends. (a) Unilateral constraints; (b) adjacent constraint; (c) boundary constraints; (d) quadrilateral constraint; (e) trilateral constraints
    Deformation of standard components under random control points
    Fig. 3. Deformation of standard components under random control points
    Distribution of deflection curve under simplified model
    Fig. 4. Distribution of deflection curve under simplified model
    Selecting control points according to deflection curve and different spacing. (a) Unilateral constraints; (b) adjacent constraint; (c) boundary constraints; (d) trilateral constraints; (e) quadrilateral constraint and unconstraint
    Fig. 5. Selecting control points according to deflection curve and different spacing. (a) Unilateral constraints; (b) adjacent constraint; (c) boundary constraints; (d) trilateral constraints; (e) quadrilateral constraint and unconstraint
    Mapping relationship diagram
    Fig. 6. Mapping relationship diagram
    Diagram of proportional relation of y plane
    Fig. 7. Diagram of proportional relation of y plane
    3D reconstruction based on control points
    Fig. 8. 3D reconstruction based on control points
    Optimal selection of control points. (a) Set a control point at maximum deflection; (b) add a control point in reverse direction of flexure; (c) control points are added one by one in reverse direction of flexure
    Fig. 9. Optimal selection of control points. (a) Set a control point at maximum deflection; (b) add a control point in reverse direction of flexure; (c) control points are added one by one in reverse direction of flexure
    Analysis route of surface deformation[15]
    Fig. 10. Analysis route of surface deformation15
    Deformation coincidence diagram of experimental surface. (a) Adjacent constraint; (b) boundary constraints; (c) quadrilateral constraint; (d) unilateral constraints
    Fig. 11. Deformation coincidence diagram of experimental surface. (a) Adjacent constraint; (b) boundary constraints; (c) quadrilateral constraint; (d) unilateral constraints
    Test deformation and control points diagram of an aircraft wing
    Fig. 12. Test deformation and control points diagram of an aircraft wing
    Deformation coincidence degree analysis of an aircraft wing
    Fig. 13. Deformation coincidence degree analysis of an aircraft wing
    Point nameRealistic deformation modelLaplace deformation modelCoincidence test
    xyzxyzDxDyDzDMag
    Pt1179.625973.7721171.030179.627973.7721171.0140.0020.000-0.0160.016
    Pt2486.712592.8921177.927486.776592.9141178.0040.0650.0220.0770.103
    Pt31398.368474.006788.1481398.449474.030788.2140.0810.0250.0660.107
    Pt42046.715162.067141.9222046.815162.103141.9570.1000.0360.0350.112
    Pt51613.514796.529246.4221613.592796.557246.4490.0780.0280.0280.087
    Pt61220.5681275.179251.8411220.5881275.179251.8730.0200.0000.0320.038
    Pt7907.1341187.139727.732907.1361187.139727.7050.0020.000-0.0270.027
    Table 1. Deformation control point coincidence degree analysis of an aircraft wing
    MethodData acquisition modeSurface of repetition /minOperationPrecision /mmCharacteristic
    Traditional methodsScanning technique200Tedious0.10~0.15Large deformation has limitations
    Proposed methodMeasuring point80Simple0.12Accuracy control depends on human operation
    Table 2. Advantages and disadvantages comparison between traditional methods and proposed method
    Xiaobo Cheng, Yundong Zhu, Xuezhu Lin, Funing Liu, Linxin Yin. Recurrence of Laplace Deformation Surface Based on Optimized Control Point Monitoring[J]. Laser & Optoelectronics Progress, 2022, 59(19): 1912002
    Download Citation