• Photonics Research
  • Vol. 10, Issue 1, 14 (2022)
Fengya Lu1, Lei Gong1、2、4、*, Yan Kuai1, Xi Tang1, Yifeng Xiang3, Pei Wang1, and Douguo Zhang1、2、5、*
Author Affiliations
  • 1Advanced Laser Technology Laboratory of Anhui Province, Department of Optics and Optical Engineering, University of Science and Technology of China, Hefei 230026, China
  • 2Hefei National Laboratory for Physical Sciences at the Microscale, University of Science and Technology of China, Hefei 230026, China
  • 3Fujian Provincial Key Laboratory of Photonics Technology, College of Photonic and Electronic Engineering, Fujian Normal University, Fuzhou 350117, China
  • 4e-mail: leigong@ustc.edu.cn
  • 5e-mail: dgzhang@ustc.edu.cn
  • show less
    DOI: 10.1364/PRJ.439288 Cite this Article Set citation alerts
    Fengya Lu, Lei Gong, Yan Kuai, Xi Tang, Yifeng Xiang, Pei Wang, Douguo Zhang. Controllable optofluidic assembly of biological cells using an all-dielectric one-dimensional photonic crystal[J]. Photonics Research, 2022, 10(1): 14 Copy Citation Text show less
    Schematic of the 1DPC and its property. (a) Schematic diagram of the 1DPC. z=0 is the 1DPC–water interface, and the point (0,0) represents the center of the focused beam. The laser beam is focused above the 1DPC–water interface at distance of h. (b) Calculated angular reflectance spectra of the 1DPC for TE- (blue) and TM- (black) polarized incident beams. (c) The electric field distribution of the focused BSWs in the x−z plane normalized by the maximum. (d) Simulated temperature distribution in the x−z plane. The horizontal line at z=0 indicates the 1DPC–water interface.
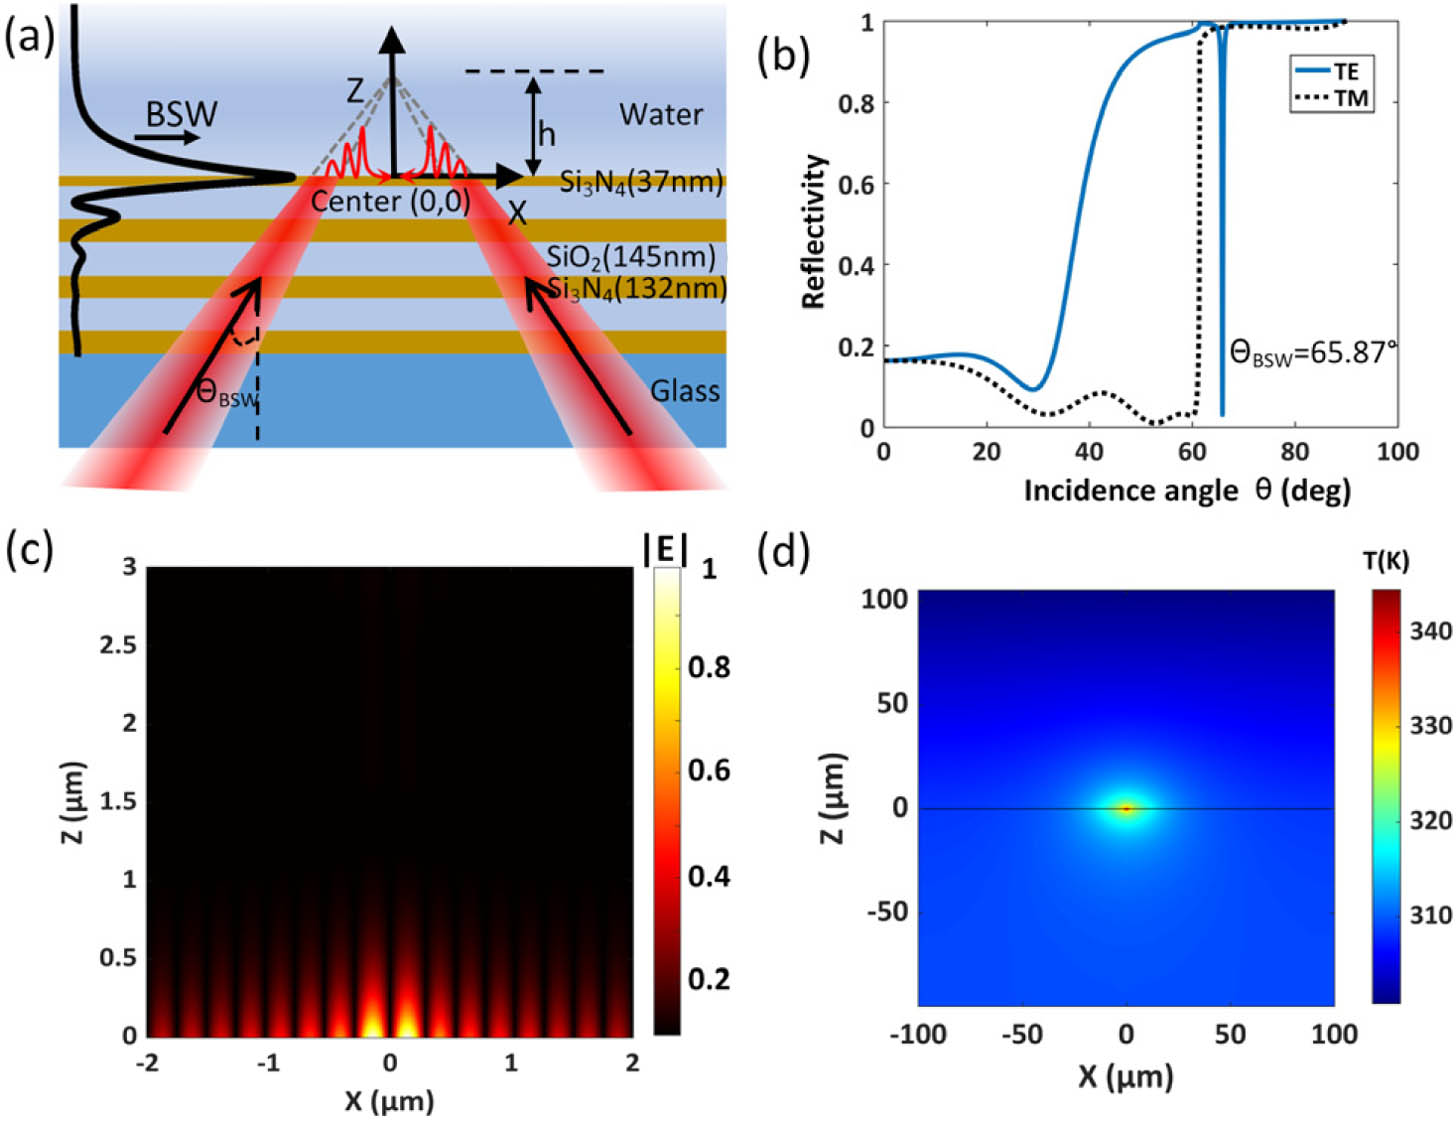
    Fig. 1. Schematic of the 1DPC and its property. (a) Schematic diagram of the 1DPC. z=0 is the 1DPC–water interface, and the point (0,0) represents the center of the focused beam. The laser beam is focused above the 1DPC–water interface at distance of h. (b) Calculated angular reflectance spectra of the 1DPC for TE- (blue) and TM- (black) polarized incident beams. (c) The electric field distribution of the focused BSWs in the xz plane normalized by the maximum. (d) Simulated temperature distribution in the xz plane. The horizontal line at z=0 indicates the 1DPC–water interface.
    Working principle of cell assembly with the optofluidic manipulation. (a) Thermophoretic trapping of biological cells in fluidics. Water molecules form an electric double layer on the surface of the negatively charged cells. Under the action of thermophoresis, the biological cells with negative Soret coefficients will move to the hot regions and finally be trapped at the hot spot. The red arrow indicates the movement direction of cells. (b) Simulated maps of temperature gradient along the radial (∇Tr, black solid line) and vertical directions (∇Tz, red dotted line) in the x−y plane, where the plane is located at 100 nm above the 1DPC–water interface. The inset shows the direction of temperature gradient. (c) The simulated convective velocity distribution inside the water. The color map shows the magnitude of the flow speed, and the streamlines represent the directions of the flow. (d) Main actions in the optofluidic assembly of biological cells: the flow-induced force (arrows in yellow), the thermophoresis (arrows in red) caused by temperature gradient, and the optical force (illustrated by a focused laser beam) associated with the focused BSWs.
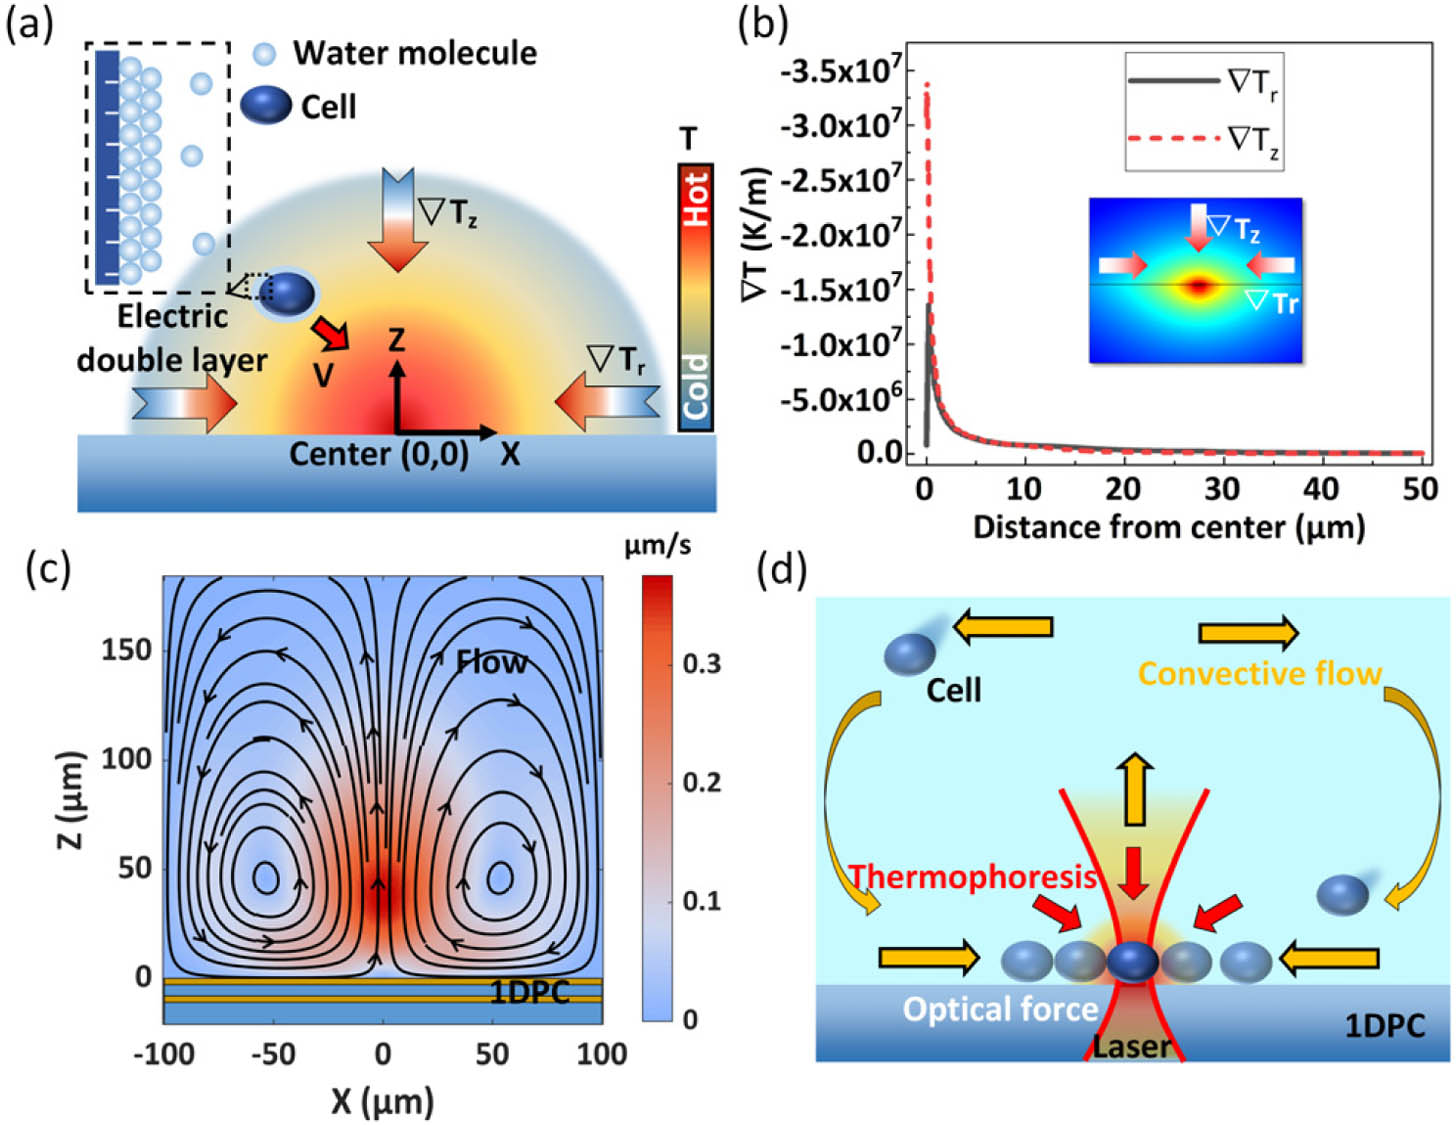
    Fig. 2. Working principle of cell assembly with the optofluidic manipulation. (a) Thermophoretic trapping of biological cells in fluidics. Water molecules form an electric double layer on the surface of the negatively charged cells. Under the action of thermophoresis, the biological cells with negative Soret coefficients will move to the hot regions and finally be trapped at the hot spot. The red arrow indicates the movement direction of cells. (b) Simulated maps of temperature gradient along the radial (Tr, black solid line) and vertical directions (Tz, red dotted line) in the xy plane, where the plane is located at 100 nm above the 1DPC–water interface. The inset shows the direction of temperature gradient. (c) The simulated convective velocity distribution inside the water. The color map shows the magnitude of the flow speed, and the streamlines represent the directions of the flow. (d) Main actions in the optofluidic assembly of biological cells: the flow-induced force (arrows in yellow), the thermophoresis (arrows in red) caused by temperature gradient, and the optical force (illustrated by a focused laser beam) associated with the focused BSWs.
    Schematic diagram of the experimental setup. The pair of axicons can generate a ring-shaped laser beam; besides, the polarizer and vertex retarder are used to generate an annular azimuthally polarized beam. The inset graph shows the BFP image of the laser beam reflected from the 1DPC shot by CCD1, in which the dark ring (labeled θBSW=65.37°) verifies that the BSW has been efficiently excited in all directions by the ring-shaped azimuthally polarized beam.
    Fig. 3. Schematic diagram of the experimental setup. The pair of axicons can generate a ring-shaped laser beam; besides, the polarizer and vertex retarder are used to generate an annular azimuthally polarized beam. The inset graph shows the BFP image of the laser beam reflected from the 1DPC shot by CCD1, in which the dark ring (labeled θBSW=65.37°) verifies that the BSW has been efficiently excited in all directions by the ring-shaped azimuthally polarized beam.
    Optical and thermophoretic manipulation of colloid particles and yeast cells. (a) The uncaptured particles (yellow circle) are convected away from the interface by the optofluidic flow. (b) In contrast to the colloid particles (yellow circle), yeast cells are trapped (t=25 s) and finally form an assembly on the surface. (c) A single colloid particle (shown in red circle) is trapped by the short-ranged optical force and transported to any position, where the white arrow indicates the movement direction and the uncaptured yeast cell was labeled with a yellow circle. When the substrate stops, the cells gather around the trapped particle under the action of the thermal convection flow and thermophoresis. Scale bar: 10 μm.
    Fig. 4. Optical and thermophoretic manipulation of colloid particles and yeast cells. (a) The uncaptured particles (yellow circle) are convected away from the interface by the optofluidic flow. (b) In contrast to the colloid particles (yellow circle), yeast cells are trapped (t=25  s) and finally form an assembly on the surface. (c) A single colloid particle (shown in red circle) is trapped by the short-ranged optical force and transported to any position, where the white arrow indicates the movement direction and the uncaptured yeast cell was labeled with a yellow circle. When the substrate stops, the cells gather around the trapped particle under the action of the thermal convection flow and thermophoresis. Scale bar: 10 μm.
    Reversible assembly of yeast cells. (a) Time-sequenced set of the cell assembly under the irradiation of 60 mW laser power at 671 nm. At t=5 s, the laser is switched on, and a single yeast cell is trapped (red dot). Other yeast cells move to the center and form a tightly packed assembly under the action of the thermophoresis and long-ranged thermal convection. The yeast cells labeled with yellow circles gather from different directions. Once the laser is switched off (t=180 s), the cells return to a state of free diffusion. The red dotted circle indicates the illumination area of the laser beam. (b) The migration velocity of cells as a function of the distance from the center, where the solid blue line fitted by polynomials is drawn as a visual guide. (c) The number of trapped cells as a function of the illumination time. The scale bar is 10 μm.
    Fig. 5. Reversible assembly of yeast cells. (a) Time-sequenced set of the cell assembly under the irradiation of 60 mW laser power at 671 nm. At t=5  s, the laser is switched on, and a single yeast cell is trapped (red dot). Other yeast cells move to the center and form a tightly packed assembly under the action of the thermophoresis and long-ranged thermal convection. The yeast cells labeled with yellow circles gather from different directions. Once the laser is switched off (t=180  s), the cells return to a state of free diffusion. The red dotted circle indicates the illumination area of the laser beam. (b) The migration velocity of cells as a function of the distance from the center, where the solid blue line fitted by polynomials is drawn as a visual guide. (c) The number of trapped cells as a function of the illumination time. The scale bar is 10 μm.
    Crystallization of yeast cells. (a) Image of the optofluidic crystallization of yeast cells. The cells are squeezed into polygons due to their deformability. The scale bar is 10 μm. (b) Outlines of the deformed cells. The edge numbers of the polygons are labeled.
    Fig. 6. Crystallization of yeast cells. (a) Image of the optofluidic crystallization of yeast cells. The cells are squeezed into polygons due to their deformability. The scale bar is 10 μm. (b) Outlines of the deformed cells. The edge numbers of the polygons are labeled.
    Angular dependence of the cell assembly. (a) Schematic of the incident angle. (b) Assembly process of yeast cells at θBSW (65.37°). (c), (d) No accumulation of yeast cells forms after 4 min when the incidence angle mismatches θBSW. The dashed circles indicate the illumination region of the laser beam. Scale bar: 20 μm.
    Fig. 7. Angular dependence of the cell assembly. (a) Schematic of the incident angle. (b) Assembly process of yeast cells at θBSW (65.37°). (c), (d) No accumulation of yeast cells forms after 4 min when the incidence angle mismatches θBSW. The dashed circles indicate the illumination region of the laser beam. Scale bar: 20 μm.
    Trapping and assembly of E. coli cells. (a) Stable trapping of a single E. coli (red circle). The white arrow indicates the direction of stage movement, and the yellow circle indicates the reference on the substrate. (b) Assembly process of E. coli. The scale bar is 5 μm.
    Fig. 8. Trapping and assembly of E. coli cells. (a) Stable trapping of a single E. coli (red circle). The white arrow indicates the direction of stage movement, and the yellow circle indicates the reference on the substrate. (b) Assembly process of E. coli. The scale bar is 5 μm.
    Fengya Lu, Lei Gong, Yan Kuai, Xi Tang, Yifeng Xiang, Pei Wang, Douguo Zhang. Controllable optofluidic assembly of biological cells using an all-dielectric one-dimensional photonic crystal[J]. Photonics Research, 2022, 10(1): 14
    Download Citation