
Qiang Yi, Fan Ye, Shijian Meng, Jian Lu, Jianlun Yang, Qingyuan Hu, Hongsheng Guo, Faxin Chen, Zhanchang Huang, Shuqing Jiang, Jiamin Ning, Xiaosong Yan, Ruihua Yang, Rongkun Xu, Zeping Xu, Zhenghong Li. Progress of Z-Pinch Dynamic Hohlraum Experiments on 8-MA Facility[J]. Acta Optica Sinica, 2022, 42(11): 1134009
- Acta Optica Sinica
- Vol. 42, Issue 11, 1134009 (2022)
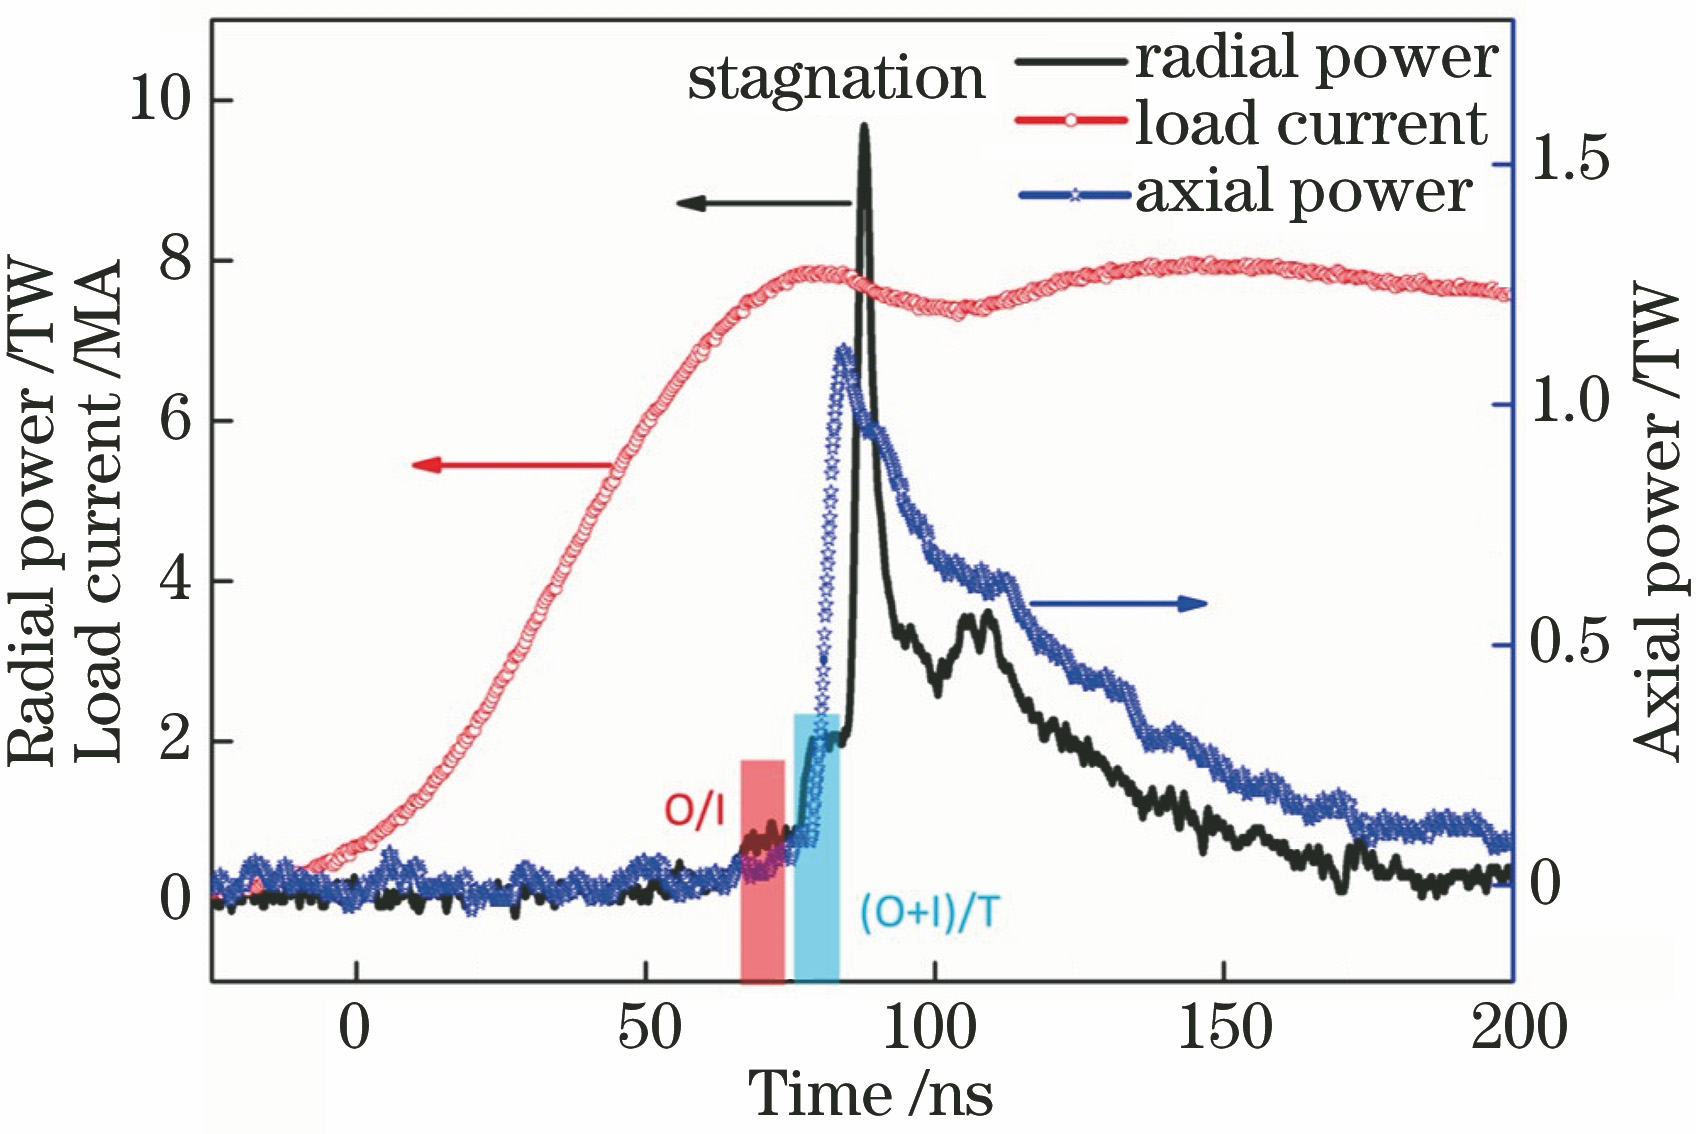
Fig. 1. Radial power and load current waveform of dynamic hohlraum on the 8-MA facility
![Schematics of simulataneous double-energy-region X-ray imaging diagnostic technique. Pinholes without beryllium filters correspond to soft X-ray images (50--400 eV); pinholes with beryllium filters correspond to hard X-ray images (>800 eV)[39]](/richHtml/gxxb/2022/42/11/1134009/img_2.jpg)
Fig. 2. Schematics of simulataneous double-energy-region X-ray imaging diagnostic technique. Pinholes without beryllium filters correspond to soft X-ray images (50--400 eV); pinholes with beryllium filters correspond to hard X-ray images (>800 eV)[39]
Fig. 3. Shock wave formation and propagation observed in shot 334[39]. (left) Soft X-ray image; (middle) hard X-ray image, dashed line is the axial diagnostic hole; (right) radial normalized image intensity at different moments
Fig. 4. Hohlraum formation evidence of separation of thermal and shock wave observed in shot 335[39]. (left) Soft and hard X-ray framing images at different moments; (right) radiation brightness temperature versus radial position at different moments, where 3 vertical lines represent positions of main shock wave at different moments
Fig. 5. DH loads with different wire-array diameters
Fig. 6. Axial power comparison for DH loads with different wire-array diameters
Fig. 7. Axial radiation power comparison for DHs at different load heights. (a) Peak-value; (b) rising time
Fig. 8. DH’s end-on radiation brightness temperature comparison for different cases. (a) DHs at different load heights, for convenience to see them clearly, series of h=10 mm are shifted positively by 10 ns; (b) DHs with different bus electrodes structure in 2018 and 2019
Fig. 9. Experimental setup of research on the HXR interference to neutron diagnostic[40]
Fig. 10. Ag AD counts at different radiation fields[40]. (a) DH+capsule at the 8-MA facility; (b) DH at the 8-MA facility; (c) single wire-array at the 8-MA facility; (d) 4 MeV bremsstrahlung X-ray source (Reproduced with permission, Ref. [40])
Fig. 11. Interference of bremsstrahlung HXR to two kinds of neutron detectors. (a) Early intense bremsstrahlung HXR and successive multi pulses observed by BF3 counter[41]; (b) intense bremsstrahlung HXR and successive scintillator afterglow observed by nTOF[40] (Reproduced with permission, Refs. [40] and [41])
Fig. 12. Upgraded nTOF detection system, where LS represents liquid scintillator
Fig. 13. Measured result by upgraded nTOF-2[41](Reproduced with permission, Ref. [41])
Fig. 14. Geometrical setup of FSSR-2D[65]
Fig. 15. Geometrical coordinate representation method during ray tracing simulation
Fig. 16. Simulation results of spectral line profiles
Fig. 17. Reflectivity of spherical mica crystal calculated by XOP code


Set citation alerts for the article
Please enter your email address

© Copyright 2018-2021 | Chinese Laser Press. All Rights Reserved 沪ICP备15018463号-20