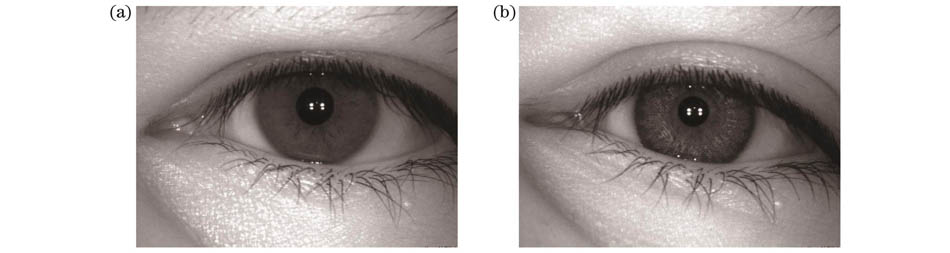
Fig. 1. Real iris and textured contact lens iris. (a) Real iris; (b) textured contact lens iris
Fig. 2. RAINet iris anti-spoofing detection network framework
Fig. 3. Inverse residual block of Bottleneck
Fig. 4. Location parameters of feature region. (a) Location parameters of iris region; (b) location parameters of texture region;(c) texture region after interpolation
Fig. 5. Image masks of feature region. (a) Image masks of iris region; (b) image masks of texture region
Fig. 6. Sample images from IIITD CLI database. (a) Real iris from Cogent; (b) textured contact lens iris from Cogent; (c) real iris from Vista; (d) texture contact lens iris from Vista
Fig. 7. Sample images from ND series databases. (a) Real iris from NDC LG4000; (b) textured contact lens iris from NDC LG4000; (c) real iris from NDC AD100; (d) textured contact lens iris from NDC AD100; (e) real iris from NDCLD15; (f) textured contact lens iris from NDCLD15
Fig. 8. ROC curves under intra-sensor detection
Fig. 9. ROC curves under inter-sensor detection
Fig. 10. ROC curves under inter-database detection
Network | Params /MB | FLOPs / |
---|
VGG16 | 134.28 | 61.75 | MobileNetV2 | 2.22 | 1.28 |
|
Table 1. Comparison of MobileNetV2 and VGG16
Input | Operator | Factor | Output | Frequency | Step |
---|
224×224×3 | Conv2d | | 32 | 1 | 2 | 112×112×32 | Bottleneck | 1 | 16 | 1 | 1 | 112×112×16 | Bottleneck | 6 | 24 | 2 | 2 | 56×56×24 | Bottleneck | 6 | 32 | 3 | 2 | 28×28×32 | Bottleneck | 6 | 64 | 4 | 2 | 14×14×64 | Bottleneck | 6 | 96 | 3 | 1 | 14×14×96 | Bottleneck | 6 | 160 | 1 | 1 | 7×7×160 | Bottleneck | 6 | 320 | 1 | 1 |
|
Table 2. Structural parameters of MobileNetV2 feature layer
Database | Network | | | |
---|
Cogent (intra-sensor) | G-FCN | 100.00 | 99.15 | 99.57 | I-FCN | 100.00 | 99.43 | 99.71 | T-FCN | 100.00 | 99.70 | 99.85 | RAINet3 | 100.00 | 99.43 | 99.71 | RAINet | 100.00 | 99.70 | 99.85 | Cogent/Vista (inter-sensor) | G-FCN | 100.00 | 98.03 | 99.02 | I-FCN | 100.00 | 100.00 | 100.00 | T-FCN | 100.00 | 99.48 | 99.74 | RAINet3 | 100.00 | 99.34 | 99.67 | RAINet | 100.00 | 99.68 | 99.84 | Cogent/NDC LG4000 (inter-database) | G-FCN | 91.25 | 100.00 | 95.62 | I-FCN | 96.22 | 100.00 | 98.11 | T-FCN | 96.45 | 100.00 | 98.22 | RAINet3 | 94.56 | 100.00 | 97.27 | RAINet | 96.93 | 100.00 | 98.46 |
|
Table 3. Results of ablation experiments
Database | Network | | | |
---|
Cogent | RACNN | 100.00 | 99.24 | 99.62 | GHCLNet | 100.00 | 89.86 | 94.98 | DCLNet | 99.10 | 94.19 | 96.64 | RAINet | 100.00 | 99.70 | 99.85 | Vista | RACNN | 100.00 | 97.72 | 98.86 | GHCLNet | 100.00 | 94.60 | 97.30 | DCLNet | 100.00 | 93.19 | 96.60 | RAINet | 100.00 | 100.00 | 100.00 | NDC LG4000 | RACNN | 100.00 | 99.21 | 99.60 | GHCLNet | 99.75 | 95.24 | 97.50 | DCLNet | 99.93 | 92.86 | 96.40 | RAINet | 100.00 | 99.78 | 99.89 | NDC AD100 | RACNN | 100.00 | 99.52 | 99.76 | GHCLNet | 100.00 | 91.67 | 95.84 | DCLNet | 98.50 | 89.49 | 94.00 | RAINet | 100.00 | 100.00 | 100.00 |
|
Table 4. Comparison of CCR under intra-sensor detection unit: %
Database | Network | | | |
---|
Cogent/Vista | RACNN | 100.00 | 99.68 | 99.84 | GHCLNet | 99.25 | 93.40 | 96.33 | DCLNet | 99.83 | 89.55 | 94.69 | RAINet | 100.00 | 99.68 | 99.84 | Vista/Cogent | RACNN | 90.21 | 96.17 | 93.19 | GHCLNet | 85.36 | 96.74 | 91.05 | DCLNet | 99.82 | 81.43 | 90.63 | RAINet | 94.54 | 97.48 | 96.03 | NDC LG4000/AD100 | RACNN | 100.00 | 97.33 | 98.66 | GHCLNet | 98.00 | 91.90 | 94.95 | DCLNet | 100.00 | 92.00 | 96.00 | RAINet | 100.00 | 100.00 | 100.00 | NDC AD100/LG4000 | RACNN | 100.00 | 84.18 | 92.09 | GHCLNet | 100.00 | 81.25 | 90.63 | DCLNet | 97.92 | 83.00 | 90.46 | RAINet | 100.00 | 86.76 | 93.36 |
|
Table 5. Comparison of CCR under inter-sensor detection
Database | Network | | | |
---|
Cogent/NDC LG4000 | RACNN | 93.12 | 100.00 | 96.56 | GHCLNet | 90.07 | 100.00 | 95.02 | DCLNet | 87.94 | 100.00 | 93.95 | RAINet | 96.93 | 100.00 | 98.46 | Cogent/ND 15 | RACNN | 100.00 | 88.80 | 94.40 | GHCLNet | 90.07 | 100.00 | 95.02 | DCLNet | 100.00 | 81.40 | 90.70 | RAINet | 100.00 | 92.20 | 96.10 | Cogent/ND 19 | RACNN | 92.70 | 99.80 | 96.15 | GHCLNet | 90.17 | 99.76 | 93.46 | DCLNet | 88.68 | 100.00 | 92.57 | RAINet | 93.90 | 100.00 | 96.95 | NDC LG4000/ND 15 | RACNN | 98.00 | 98.80 | 98.40 | GHCLNet | 99.60 | 95.60 | 97.60 | DCLNet | 98.80 | 99.40 | 99.10 | RAINet | 99.40 | 99.20 | 99.30 | NDC LG4000/ND 19 | RACNNt | 100.00 | 99.52 | 99.77 | GHCLNet | 100.00 | 94.05 | 97.96 | DCLNet | 100.00 | 89.76 | 96.49 | RAINet | 100.00 | 99.76 | 99.91 | ND 15/ND 19 | RACNN | 92.82 | 100.00 | 96.43 | GHCLNet | 93.03 | 100.00 | 95.42 | DCLNet | 92.41 | 100.00 | 95.02 | RAINet | 92.91 | 100.00 | 96.45 |
|
Table 6. Comparison of CCR under inter-database detection
Network | Params /MB | FLOPs / |
---|
RACNN | 373.34 | 92.65 | GHCLNet | 23.51 | 4.12 | DCLNet | 6.96 | 2.88 | RAINet | 86.96 | 1.87 |
|
Table 7. Comparison of calculated costs for each network