• Advanced Photonics
  • Vol. 2, Issue 6, 065001 (2020)
Mengyun Hu1、2, Junsong Peng1、2, Sheng Niu1, and Heping Zeng1、2、3、*
Author Affiliations
  • 1East China Normal University, State Key Laboratory of Precision Spectroscopy, Shanghai, China
  • 2Chongqing Institute of East China Normal University, Chongqing, China
  • 3Jinan Institute of Quantum Technology, Jinan, China
  • show less
    DOI: 10.1117/1.AP.2.6.065001 Cite this Article Set citation alerts
    Mengyun Hu, Junsong Peng, Sheng Niu, Heping Zeng. Plasma-grating-induced breakdown spectroscopy[J]. Advanced Photonics, 2020, 2(6): 065001 Copy Citation Text show less
    Experimental schematic. Top view of the noncollinear interaction area where two filaments interfere and create a plasma grating, with a focus lens collecting the plasma emission into the spectrometer from the side direction after plasma grating ablating the sample pellet.
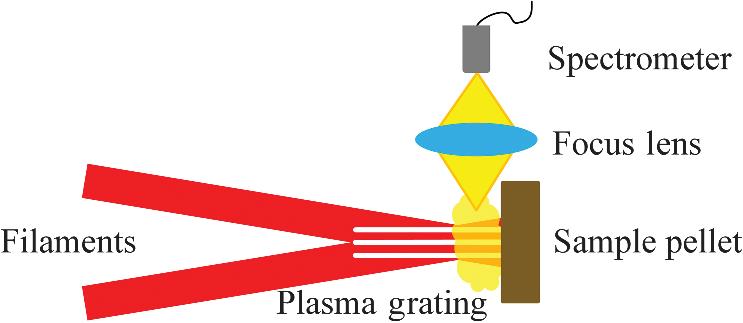
    Fig. 1. Experimental schematic. Top view of the noncollinear interaction area where two filaments interfere and create a plasma grating, with a focus lens collecting the plasma emission into the spectrometer from the side direction after plasma grating ablating the sample pellet.
    (a) Intensity of the Si 288.2 nm line as a function of the laser pulse energy detected with the FIBS and GIBS systems. (b) Intensity of the Si 288.2 nm line obtained by interaction of two beams with different polarizations.
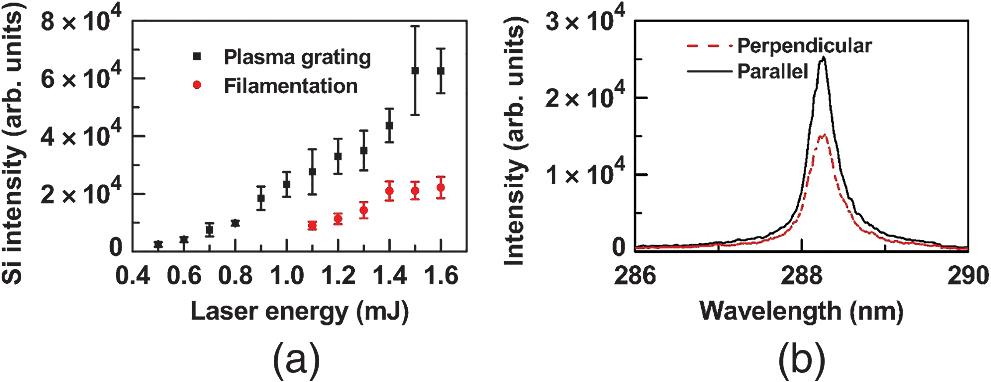
    Fig. 2. (a) Intensity of the Si 288.2 nm line as a function of the laser pulse energy detected with the FIBS and GIBS systems. (b) Intensity of the Si 288.2 nm line obtained by interaction of two beams with different polarizations.
    Time evolution for intensities of four spectral lines (Al 394.5 nm, Ca 393.4 nm, Mg 517.3 nm, and Si 288.2 nm) detected with (a) an FIBS and (b) a GIBS system.
    Fig. 3. Time evolution for intensities of four spectral lines (Al 394.5 nm, Ca 393.4 nm, Mg 517.3 nm, and Si 288.2 nm) detected with (a) an FIBS and (b) a GIBS system.
    Intensity of the Cr 425.43 nm line as a function of the prepared Cr concentration detected with (a) ns-LIBS, (b) fs-LIBS, (c) FIBS, and (d) GIBS systems.
    Fig. 4. Intensity of the Cr 425.43 nm line as a function of the prepared Cr concentration detected with (a) ns-LIBS, (b) fs-LIBS, (c) FIBS, and (d) GIBS systems.
    Sample nameElement concentration
    SiO2 (%)Al2O3 (%)CaO (%)MgO (%)Cr (ppm)
    GSF-03N.A.N.A.1.06N.A.104
    GSS-0374.7212.241.270.5832
    GSS-0450.9523.450.260.49370
    GSS-0858.6111.928.272.3868
    GSS-2047.2810.396.482.9843
    Table 1. Element concentrations of soil samples in the experiment.
    Mengyun Hu, Junsong Peng, Sheng Niu, Heping Zeng. Plasma-grating-induced breakdown spectroscopy[J]. Advanced Photonics, 2020, 2(6): 065001
    Download Citation