Laser-induced breakdown spectroscopy (LIBS) is a useful tool for determination of elements in solids, liquids, and gases. For nanosecond LIBS (ns-LIBS), the plasma shielding effect limits its reproducibility, repeatability, and signal-to-noise ratios. Although femtosecond laser filament induced breakdown spectroscopy (FIBS) has no plasma shielding effects, the power density clamping inside the filaments limits the measurement sensitivity. We propose and demonstrate plasma-grating-induced breakdown spectroscopy (GIBS). The technique relies on a plasma excitation source—a plasma grating generated by the interference of two noncollinear femtosecond filaments. We demonstrate that GIBS can overcome the limitations of standard techniques such as ns-LIBS and FIBS. Signal intensity enhancement with GIBS is observed to be greater than 3 times that of FIBS. The matrix effect is also significantly reduced with GIBS, by virtue of the high power and electron density of the plasma grating, demonstrating great potential for analyzing samples with complex matrix.
Laser-induced breakdown spectroscopy (LIBS) is one of the most effective tools used to study the interaction between lasers and matter. Compared with other techniques, like atomic absorption spectroscopy and inductively coupled plasma optical emission spectroscopy, LIBS has some unique advantages including the capacity of direct analysis without a complex pretreatment of the sample, rapid response, and multiple elemental analysis ability. LIBS is suitable for special requirements of practical solid,1–4 liquid,5–8 and gas analyses.9,10
For traditional LIBS systems, nanosecond (ns) pulse lasers are widely used. But due to some adverse impacts like laser emission intensity, long pulse duration, and plasma shielding effect,11 the ns-LIBS has drawbacks, including low reproducibility and repeatability, low signal-to-noise ratios, and difficult molecular measurements. In contrast, the pulse duration of femtosecond lasers is much shorter, such that there is no plasma shielding effect and the interaction time of laser and matter is very short. Therefore, signal-to-background ratios and resolutions of spectral lines are higher.12,13 Meanwhile, because of the high power density, materials could be ionized and dissociated quickly, and thus the ions and molecular fragments could be stimulated effectively.14–16
Filament-induced breakdown spectroscopy (FIBS) combines the LIBS technique and a femtosecond laser filament. 17 When a high-intensity femtosecond laser pulse transmits in the air, due to the dynamic balance between the self-focusing of the Kerr effect and the defocusing of the plasma formed by multiphoton ionization, a long and stable laser plasma channel forms, i.e., a femtosecond (fs) laser filament.18–20 In addition to the advantages of the fs laser pulse, FIBS can overcome the diffraction limit and deliver high laser intensities at remote locations.17 Systematical comparative investigations on LIBS using ns and fs pulses, as well as filaments under different conditions, were recently reported.21,22 The laser intensity clamping effect is a limitation of FIBS,23–26 as the power and electron densities are saturated when the laser energy increases. This imposes a limitation on the sensitivity improvement. The interaction of multiple femtosecond filaments could generate plasma gratings27–32 and can break through the clamped intensity limit for free electron generation and acceleration.33
Sign up for Advanced Photonics TOC. Get the latest issue of Advanced Photonics delivered right to you!Sign up now
In this work, we propose and demonstrate the plasma-grating-induced breakdown spectroscopy (GIBS) technique. The plasma grating is generated by two noncollinear femtosecond filaments. GIBS is proven to be useful to overcome the drawbacks of ns-LIBS, fs-LIBS, and FIBS. With GIBS, the signal intensity enhancement is greater than 3 times that obtained by FIBS with the same initial pulse. The plasma evolution is studied, and the lifetime of plasma-grating-induced plasma is found to be about twice that of filament-induced plasma. Due to the absence of plasma shielding effects, the high power, and electron density of the femtosecond plasma grating, materials could be ionized and dissociated in a more uniform manner so that the matrix effect is reduced and quantitative analyses are feasible.
2 Experimental Details
2.1 Experimental Setup
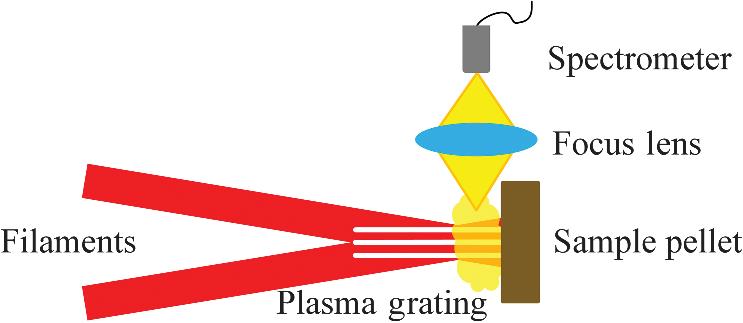
Our experimental schematic is shown in Fig. 1. Intense fs pulses were generated from a Ti:sapphire regenerative laser (Coherent) operating at 800 nm with a repetition rate of 1 kHz, a pulse duration of 50 fs, and a pulse energy up to 6 mJ. The fs laser pulses were split into two beams with almost the same energy, which were simultaneously focused by a convex lens () to produce two noncollinearly crossed filaments in air. The crossing angle of two filaments is 6.1 deg, resulting in spatial period of determined by .34 The plasma grating was generated in the intersecting region of the two filaments and then ablated sample pellets to induce the plasma emission. If one beam is blocked, this would become the fs filament-induced plasma. Sample pellets were mounted on a motorized rotation displacement stage. The plasma emission was collected by a focus lens into a piece of optical fiber with a diameter of . The fiber delivered the plasma emission into an Echelle spectrometer (Mechelle 5000, Andor Technology) equipped with an intensified charge coupled device (ICCD; iStar, Andor Technology). The acquisition mode was a single scan and the ICCD worked in the integrate-on-chip mode with gate delay of 4 ns and gate width of 100 ns.
Figure 1.Experimental schematic. Top view of the noncollinear interaction area where two filaments interfere and create a plasma grating, with a focus lens collecting the plasma emission into the spectrometer from the side direction after plasma grating ablating the sample pellet.
Five standard reference soil samples (GSS-08, GSS-04, GSS-03, GSS-20, and GSF-03) were used for the present study. All soil samples were ground carefully in a mortar to become homogeneous. Then 0.5 g of the obtained mixture powder was filled into a steel dye of 13 mm diameter. A hydraulic press was applied on the powder to obtain a pellet. The pressure of 4 MPa and time of 1 min were used for all pellets. Prepared pellets were then put on the motorized stage so that fresh materials could be irradiated and ablated continuously.
3 Results and Discussion
3.1 Signal Enhancement of GIBS
Plasma gratings are generated due to the nonlinear interaction of two filaments.30,32 The power density and electron density are higher than a single fs filament with the same pulse energy due to the constructive interference in the two-beam overlapping area. In this section, the exposure time of the spectrometer is set as 0.05 s, considering the pulse interval of 0.001 s of the 1 kHz repetitive femtosecond pulses, which means that each spectrum obtained under the integrate-on-chip mode is accumulated with 50 shots. Soil sample GSS-08 was used here. Figure 2(a) shows the relationship between the intensity of the Si 288.2 nm spectral line and the pulse energy. In Fig. 2(a), red circled points represent the results obtained by the FIBS. It can be seen that as the pulse energy increases, the signal intensity of Si tends to be saturated due to power clamping of the fs filament. Black squared points correspond to results measured by the GIBS. The signal intensity of the Si line obtained by the GIBS is about 3 times higher than that obtained by the FIBS using the same pulse energy. The two laser pulses used to form the plasma grating were equally split from the same laser pulse forming a single fs filament. The enhancement shown in Fig. 2(a) is because the interference of two filaments breaks through the clamped power of a single filament, so that the electron density inside the plasma channel is higher. For a single filament, the typical electron density is around , whereas for the plasma grating, the electron density is determined to be more than .31 As a result, inside the plasma grating, the collision and acceleration of electrons are more intense. Some accelerated electrons trigger impact ionization of molecules and more electrons are generated, giving rise to the generation of stronger plasma emission. Figure 2(b) exhibits the influence of polarizations of the two synchronous pulses. If the polarizations are parallel, the signal intensity is about twice as high as that with perpendicular polarizations. This illustrates that the interference of two filaments with the same polarization generates a stronger signal than the simple superposition of two filaments with different polarizations.
Figure 2.(a) Intensity of the Si 288.2 nm line as a function of the laser pulse energy detected with the FIBS and GIBS systems. (b) Intensity of the Si 288.2 nm line obtained by interaction of two beams with different polarizations.
Based on the results described above, in order to better understand the signal enhancement of the GIBS, we analyzed the time evolution of the plasma emission from filament and plasma grating ablation, respectively. Soil sample GSS-08 was used. The time evolutions of the intensities of four spectral lines (Al 394.5 nm, Ca 393.4 nm, Mg 517.3 nm, and Si 288.2 nm) are shown in Fig. 3 depicting the evolution of the corresponding plasma emission. Figures 3(a) and 3(b) depict the time evolution of the spectral line intensities under the filament and plasma grating conditions. The lifetime is the time taken for the intensity to decay to 1/3 of its initial value. In Fig. 3(a), the average lifetime of plasma calculated from four selected spectral lines is 64 ns, whereas in Fig. 3(b) it is 132 ns. Nearly twice extension of the plasma lifetime demonstrates that with the GIBS, the fluorescence emission of the sample plasma lasts longer and within the same collection time, the signal intensity is accumulated to a higher level. Also, plasma emission is not the direct result of the laser ablation and excitation, which should be due to a secondary process like electron collisional excitation.33 This means that a longer plasma lifetime corresponds to a higher electron density in the plasma channel, which is also consistent with the results presented in Sec. 3.1.
Figure 3.Time evolution for intensities of four spectral lines (Al 394.5 nm, Ca 393.4 nm, Mg 517.3 nm, and Si 288.2 nm) detected with (a) an FIBS and (b) a GIBS system.
In order to study the matrix effect, soil samples doped with a Cr element of different concentrations were used as target samples. The target elemental concentrations of these soil samples are given in Table 1. We prepared soil sample powders with Cr concentrations ranging from 68 to 4370 ppm.
Sample name
Element concentration
(%)
(%)
CaO (%)
MgO (%)
Cr (ppm)
GSF-03
N.A.
N.A.
1.06
N.A.
104
GSS-03
74.72
12.24
1.27
0.58
32
GSS-04
50.95
23.45
0.26
0.49
370
GSS-08
58.61
11.92
8.27
2.38
68
GSS-20
47.28
10.39
6.48
2.98
43
Table 1. Element concentrations of soil samples in the experiment.
First, we used the previous ns-LIBS experimental system described in Refs. 8 and 34 to detect these soil samples. Figure 4(a) depicts the average intensity of the Cr 425.43 nm line as a function of the Cr concentrations. Error bars correspond to the standard deviations of the six replicate measurements. Soil sample GSS-04 was used as the reference sample to obtain a calibration curve that was fitted with parabola (pink solid line) with a regression coefficient of 99.0%. As shown in Fig. 4(a), the data points obtained from other soil samples exhibit a large dispersion around the calibration curve, clearly showing a significant matrix effect among these samples.
Figure 4.Intensity of the Cr 425.43 nm line as a function of the prepared Cr concentration detected with (a) ns-LIBS, (b) fs-LIBS, (c) FIBS, and (d) GIBS systems.
In order to quantitatively assess the matrix effect among different samples, we calculated the average relative error of prediction (REP) for other soil samples with respect to the calibration curve of S3, as defined by where is the number of different concentrations prepared for a validation sample, is the measured line intensity of Cr, and is the corresponding predicted signal intensity retrieved from the calibration curve with the prepared concentration. The value of REP corresponds to the relative deviation between the actual measured intensity and the predicted intensity, which means the accuracy of predicted intensity calculated from calibration curves with known elemental concentrations, as well as that of the predicted concentration obtained from calibration curves with the measured signal intensity. The obtained REPs for all the validation samples range from 31.2% to 66.4%, which are apparently larger than the standard deviations of data. It is obvious that the calibration curve established with the S3 sample cannot be used to correctly predict the chromium concentration for most of the validation samples because of the matrix effect.
Figures 4(b)–4(d) show the relationship between the Cr spectral line intensity and concentrations from different soil samples ablated by the fs pulse (pulse energy 0.3 mJ), fs filament (pulse energy 1.6 mJ), and fs plasma grating (two pulses with total energy 1.6 mJ), respectively. Error bars for each data point correspond to the standard deviations of 20 replicated measurements. The dispersion of data points is much reduced compared to that shown in Fig. 4(a), which means the matrix effect has apparently been reduced. This should be due to the higher power density of the fs pulse and the more absolute ablation of samples. From Figs. 4(c) and 4(d), we can see that data points of different soil samples exhibit good linear distributions. In fact, the data in both Figs. 4(c) and 4(d) can be linearly fitted with regression coefficients of and 98.0%, respectively. The linear calibration curves established with different soil samples can be used to correctly predict the elemental concentrations of other soil samples detected with the same procedure.
For ns-LIBS, due to long pulse durations, there is a plasma shielding effect,11 which refers to the fact that laser-induced plasma absorbs part of incident laser energy and prevents the efficient coupling between laser and matter, resulting in a low utilization rate of laser energy. For different samples, the constituents and opacity of plasma are different, so that plasma of different samples will shield postpulse and subsequently ablate the sample surface with different efficiencies and to different extents. Therefore, the spectral line intensity of the same element in different samples would exhibit an inconsistent relationship with respect to elemental concentrations. But for fs laser pulse, before the plasma formation and other thermal response, the interaction between the laser and matter has finished and all the laser energy has already been deposited on the sample surface. There are no further effects or processes that impact the plasma formation. Power density and electron density are very high inside the fs filaments, and especially higher in the fs plasma grating so that the sample pellets could be ablated. As a result, FIBS and especially GIBS could overcome the matrix effect effectively.
4 Conclusions
We used a plasma grating from the interference of two noncollinear fs filaments to ablate and detect sample pellets. The interaction of two filaments leads to more intense electron acceleration and collision so that the local electron density inside the plasma grating is higher than that obtained with a single fs filament. The signal intensity of spectral lines detected by GIBS is enhanced by more than 3 times that obtained from a single FIBS system. The lifetime of grating-induced plasma is apparently extended. Finally, we demonstrate that using the GIBS technique, materials could be ionized and dissociated, effectively leading to reduction of the matrix effect. The GIBS technique could be a promising tool to detect samples hard to melt, ionize, or dissociate, and samples with a complex matrix.