• Laser & Optoelectronics Progress
  • Vol. 59, Issue 6, 0617019 (2022)
Jiahui Zhong1, Junxin Wu2, Yawei Kong2, Wenhua Su2, Jiong Ma1、2、*, and Lan Mi1、2、**
Author Affiliations
  • 1Institute of Biomedical Engineering and Technology, Academy for Engineer and Technology, Fudan University, Shanghai 200433, China
  • 2Department of Optical Science and Engineering, School of Information Science and Technology, Fudan University, Shanghai 200433, China
  • show less
    DOI: 10.3788/LOP202259.0617019 Cite this Article Set citation alerts
    Jiahui Zhong, Junxin Wu, Yawei Kong, Wenhua Su, Jiong Ma, Lan Mi. Automated Analysis Methods for Autofluorescence Lifetime Microscopic Images of Yeast[J]. Laser & Optoelectronics Progress, 2022, 59(6): 0617019 Copy Citation Text show less
    Structure of the segmentation network based on deep supervision and U-Net
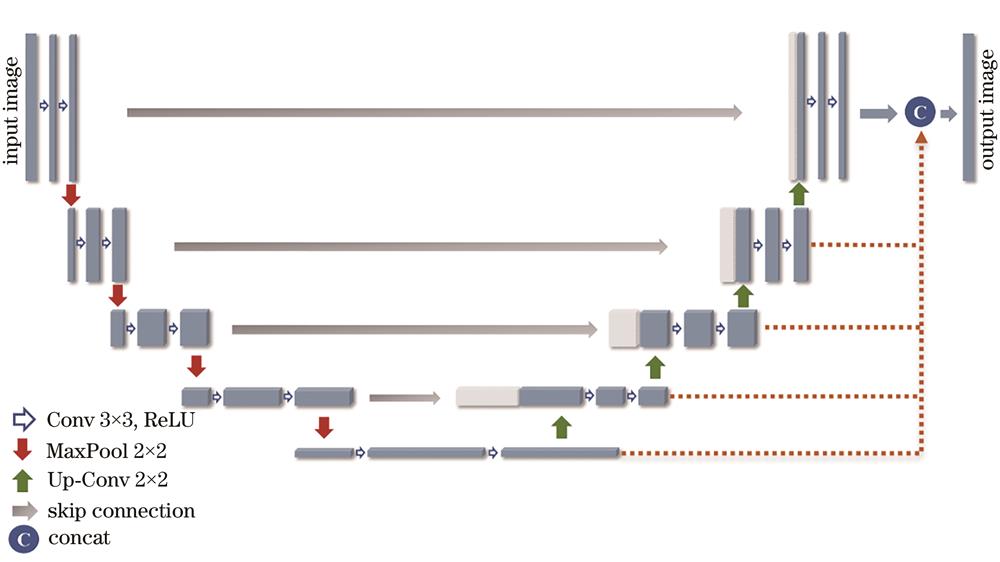
    Fig. 1. Structure of the segmentation network based on deep supervision and U-Net
    Growth curve of the SC cells
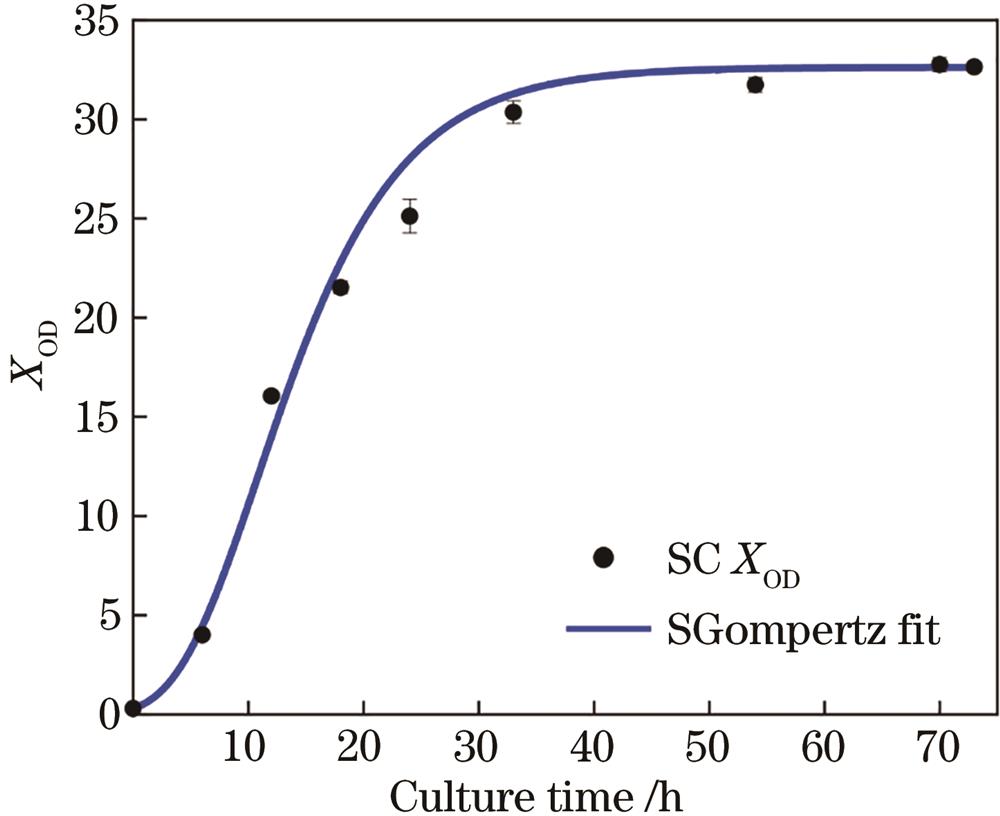
    Fig. 2. Growth curve of the SC cells
    Segmentation results of different models. (a) Image 1; (b) image 2; (c) image 3
    Fig. 3. Segmentation results of different models. (a) Image 1; (b) image 2; (c) image 3
    FLIM images, distribution curves and statistical values of yeast cells at different ages. (a) FLIM images of tm; (b) FLIM images of a2; (c) distribution curve of tm、a2 and cross-sectional area; (d) statistical average value of tm、a2 and cross-sectional area
    Fig. 4. FLIM images, distribution curves and statistical values of yeast cells at different ages. (a) FLIM images of tm; (b) FLIM images of a2; (c) distribution curve of tma2 and cross-sectional area; (d) statistical average value of tma2 and cross-sectional area
    Visualization results of t-SNE method. (a) tm map; (b) a2 map; (c) tm and a2 maps
    Fig. 5. Visualization results of t-SNE method. (a) tm map; (b) a2 map; (c) tm and a2 maps
    Clustering results and data distribution for difference feature input。(a) Input features are tm and a2; (b) two-dimensional feature distribution at 6 h; (c) two-dimensional feature distribution at 24 h; (d) two-dimensional feature distribution at 72 h; (e) input feature is tm, a2 and cross-sectional area; (f) three-dimensional feature distribution at 6 h; (g) three-dimensional feature distribution at 24 h; (h) three-dimensional feature distribution at 72 h
    Fig. 6. Clustering results and data distribution for difference feature input。(a) Input features are tm and a2; (b) two-dimensional feature distribution at 6 h; (c) two-dimensional feature distribution at 24 h; (d) two-dimensional feature distribution at 72 h; (e) input feature is tm, a2 and cross-sectional area; (f) three-dimensional feature distribution at 6 h; (g) three-dimensional feature distribution at 24 h; (h) three-dimensional feature distribution at 72 h
    ModelIOUDice score
    Otsu0.6140.756
    U-Net0.8230.903
    U-Net+watershed0.8250.904
    DS-UNet0.8300.907
    DS-UNet+watershed0.8320.908
    Table 1. Segmentation results of different segmentation models
    Feature6 h24 h72 h
    Cluster 1Cluster 2Cluster 1Cluster 2Cluster 1Cluster 2
    tm&a2(Area)93771292575
    CNN-tm891172282674
    CNN-a2821861391486
    CNN-tm&a2(Area)792158421387
    Table 2. Proportion of the number of cells in different clusters in different input characteristics
    Jiahui Zhong, Junxin Wu, Yawei Kong, Wenhua Su, Jiong Ma, Lan Mi. Automated Analysis Methods for Autofluorescence Lifetime Microscopic Images of Yeast[J]. Laser & Optoelectronics Progress, 2022, 59(6): 0617019
    Download Citation