
Yanqing Deng, Dongning Yue, Mufei Luo, Xu Zhao, Yaojun Li, Xulei Ge, Feng Liu, Suming Weng, Min Chen, Xiaohui Yuan, Jie Zhang, "Effects of second-order dispersion of ultrashort laser pulse on stimulated Raman scattering," High Power Laser Sci. Eng. 10, 06000e39 (2022)
- High Power Laser Science and Engineering
- Vol. 10, Issue 6, 06000e39 (2022)
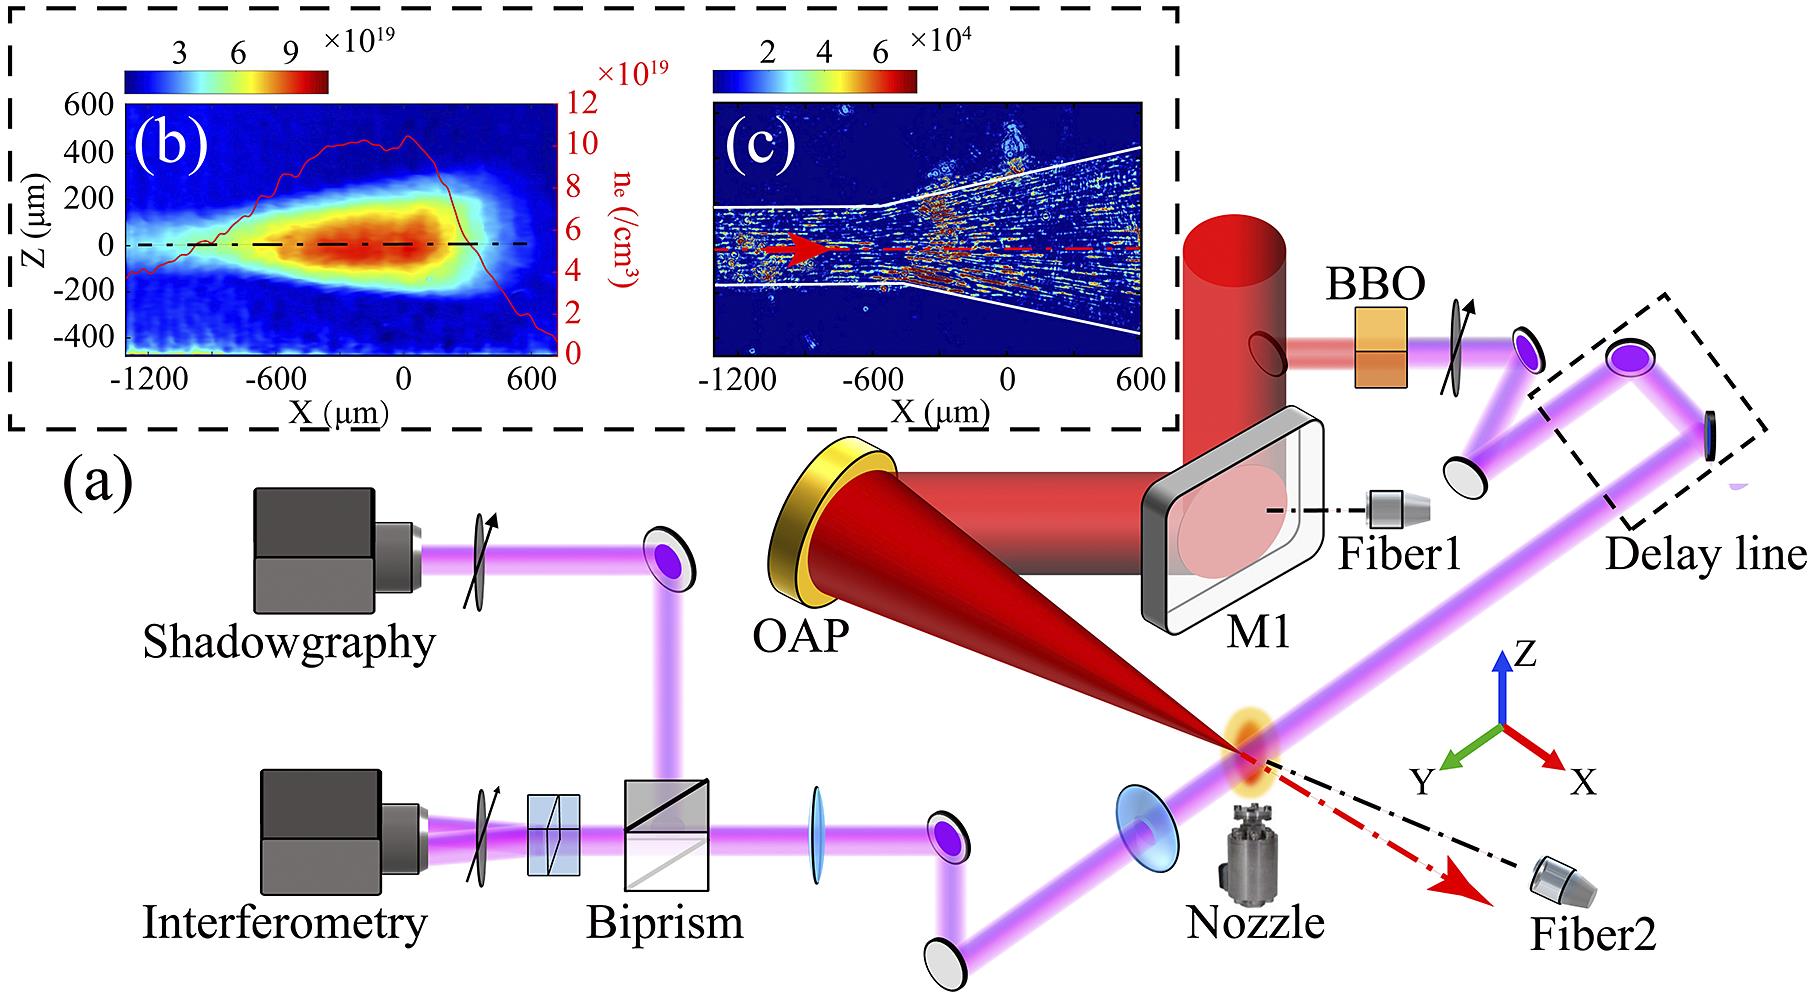
Fig. 1. (a) Schematic layout of the experimental setup. (b) Image of the typical electron density distribution and the on-axis density lineout (red solid line) with  = 0. (c) The corresponding shadowgraph, where the color bar denotes the signal count in the charge-coupled device (CCD). The laser is incident from the left-hand side. Here,
  ps is denoted when the main laser is at
  μm. The interferogram and shadowgraphs were taken at
  ps.
ps.
= 0. (c) The corresponding shadowgraph, where the color bar denotes the signal count in the charge-coupled device (CCD). The laser is incident from the left-hand side. Here, ps is denoted when the main laser is at μm. The interferogram and shadowgraphs were taken at ps. 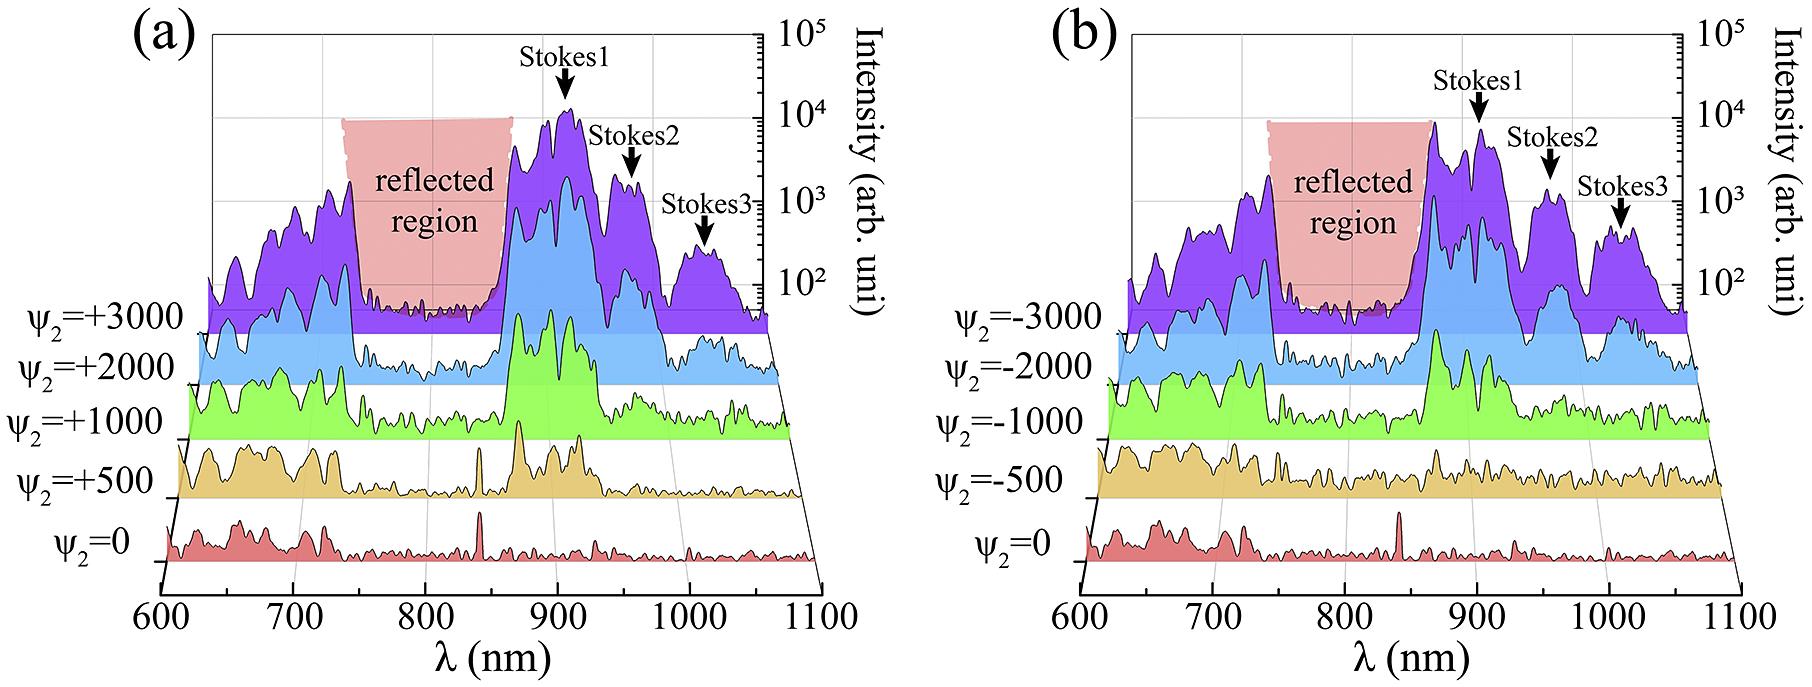
Fig. 2. The back-scattered light spectra with various (a) positive and (b) negative second-order dispersions. The absence of light within 730–870 nm is due to the total reflection of the M1 mirror in front of the collection fiber (Fiber 1 in Figure 1(a)).
Fig. 3. Integrated B-SRS spectral signal (840–1100 nm) versus pulse duration. The red solid squares are experimental results of positive  and the blue solid squares correspond to negative
  . The error bars are due to shot-to-shot fluctuations. The red dashed line presents the theoretical calculation of
  with
with  nm, whereas the blue dashed line is that with
  nm. The inset shows the calculated
  with duration for
  nm (red solid line) and
  nm (blue solid line), respectively.
and the blue solid squares correspond to negative . The error bars are due to shot-to-shot fluctuations. The red dashed line presents the theoretical calculation of with nm, whereas the blue dashed line is that with nm. The inset shows the calculated with duration for nm (red solid line) and nm (blue solid line), respectively. Fig. 4. Shadowgraphs showing side filaments at different second-order dispersions  . (a)
. (a)  = +500
  , (b)
, (b)  = +1000
  , (c)
, (c)  = +2000
  , (d)
, (d)  = –500
  , (e)
, (e)  = –1000
  and (f)
  = –2000
  . The red arrows denote the filament direction at different spatial position. The white lines show the edges of the plasma channel.
. (a) = +500 , (b) = +1000 , (c) = +2000 , (d) = –500 , (e) = –1000 and (f) = –2000 . The red arrows denote the filament direction at different spatial position. The white lines show the edges of the plasma channel. Fig. 5. The transverse plasma density profile in the cases of  and
and 
 . The solid lines and the dash-dot lines represent the profiles obtained at
  μm and
  μm, respectively.
and . The solid lines and the dash-dot lines represent the profiles obtained at μm and μm, respectively. Fig. 6. The spectra of transmitted light with (a) positive second-order dispersion and (b) negative second-order dispersion.
Fig. 7. The side-scattering angle at different spatial positions with (a) 
 , (b)
, (b) 
 and (c)
 . Orange circles and green squares correspond to the measurements of the upward scattering angle with positive and negative
  , respectively. Blue triangles are the measurements of the downward scattering angle with negative
  . The orange (blue) dashed line is the calculation based on the maximum spatial growth rate with
 (
(
 ).
).
, (b) and (c) . Orange circles and green squares correspond to the measurements of the upward scattering angle with positive and negative , respectively. Blue triangles are the measurements of the downward scattering angle with negative . The orange (blue) dashed line is the calculation based on the maximum spatial growth rate with (). Fig. 8. (a) The plasma temperature  for different
  . (b) The typical angular distributions of the spatial growth rate that correspond to the black crosses in (a). LD is for
 , and HD for
 .
.
for different . (b) The typical angular distributions of the spatial growth rate that correspond to the black crosses in (a). LD is for , and HD for .
|
Table 1. Laser parameters for different  with fixed energy (2.2 J).
with fixed energy (2.2 J). 

Set citation alerts for the article
Please enter your email address

© Copyright 2018-2021 | Chinese Laser Press. All Rights Reserved 沪ICP备15018463号-20