• High Power Laser Science and Engineering
  • Vol. 10, Issue 6, 06000e39 (2022)
Yanqing Deng1、2, Dongning Yue1、2, Mufei Luo1、2, Xu Zhao1、2, Yaojun Li1、2, Xulei Ge1、2, Feng Liu1、2, Suming Weng1、2, Min Chen1、2、*, Xiaohui Yuan1、2, and Jie Zhang1、2
Author Affiliations
  • 1Key Laboratory for Laser Plasmas (Ministry of Education), School of Physics and Astronomy, Shanghai Jiao Tong University, Shanghai, China
  • 2Collaborative Innovation Center of IFSA, Shanghai Jiao Tong University, Shanghai, China
  • show less
    DOI: 10.1017/hpl.2022.30 Cite this Article Set citation alerts
    Yanqing Deng, Dongning Yue, Mufei Luo, Xu Zhao, Yaojun Li, Xulei Ge, Feng Liu, Suming Weng, Min Chen, Xiaohui Yuan, Jie Zhang. Effects of second-order dispersion of ultrashort laser pulse on stimulated Raman scattering[J]. High Power Laser Science and Engineering, 2022, 10(6): 06000e39 Copy Citation Text show less

    Abstract

    The influence of second-order dispersion (SOD) on stimulated Raman scattering (SRS) in the interaction of an ultrashort intense laser with plasma was investigated. More significant backward SRS was observed with the increase of the absolute value of SOD ($\mid \kern-1pt\!{\psi}_2\!\kern-1pt\mid$). The integrated intensity of the scattered light is positively correlated to the driver laser pulse duration. Accompanied by the side SRS, filaments with different angles along the laser propagation direction were observed in the transverse shadowgraph. A model incorporating Landau damping and above-threshold ionization was developed to explain the SOD-dependent angular distribution of the filaments.

    1 Introduction

    Stimulated Raman scattering (SRS) is an important parametric instability in laser propagation in underdense plasma[1]. It is a three-wave process with a pump electromagnetic (EM) wave (${\omega}_0$, ${\mathbf{k}}_0$) decaying into a scattered EM wave (${\omega}_1$, ${\mathbf{k}}_1$) and an electron plasma wave (${\omega}_{epw}$, ${\mathbf{k}}_{epw}$). The instability arises in the region where the plasma density is equal to or less than a quarter of critical density ${n}_{\mathrm{c}} = {m}_{\mathrm{e}}{\omega}_0^2/\left(4\pi {e}^2\right)$, with ${m}_{\mathrm{e}}$ being the electron mass and $e$ the electron charge. Due to issues of reduced laser absorption and detrimental hot-electron generation, SRS has been extensively investigated in inertial confinement fusion studies, where multiple-beam high-energy nanosecond laser pulses are usually adopted[2].

    In addition to long laser pulses, SRS also plays key roles in ultrashort relativistic-intensity laser–plasma interactions ($>{10}^{18}$$\mathrm{W}/{\mathrm{cm}}^2$)[38]. It continuously scatters the laser energy and weakens its stable propagation, impacting on various applications, including laser wakefield acceleration (LWFA)[9], novel-mechanism ion acceleration[1012] and high-brightness X-ray generation[13,14]. Besides the drawbacks, SRS may also benefit some applications. It can enhance the electron injection in LWFA[15], and serve as a diagnostic of electron density[16,17], laser intensity[8,17,18] and plasma temperature[19].

    In past studies, the chirp of ultrashort laser pulses has been proposed to control the SRS process. It can be adjusted by introducing second-order dispersion (SOD) (${\psi}_2$), which is also known as the group velocity dispersion, into the laser pulse[2025]. Theoretical research shows that a positive chirp can enhance SRS and create a large-amplitude plasma wave. A negative chirp, on the other hand, may suppress SRS[2629]. However, only a limited number of experiments have been conducted, and inconsistent conclusions were drawn[21,22]. The dependence of Raman scattering on the SOD of ultrashort laser pulses remains elusive, and the role of subsequently varied pulse duration is still unclear.

    In this paper, the influence of SOD on SRS is experimentally studied. Optical spectroscopy and shadowgraphy were used to measure backward stimulated Raman scattering (B-SRS), side stimulated Raman scattering (S-SRS) and forward stimulated Raman scattering (F-SRS), respectively. For both positive and negative ${\psi}_2$, it was observed that the integrated B-SRS signal grows with the pulse duration. Side scattering-induced filaments were observed to be more obvious with increasing $\mid \kern-1pt\!{\psi}_2\!\kern-1pt\mid$. The angles of these filaments are spatially dependent and sensitive to ${\psi}_2$, which is explained by an analytical model. Moreover, a suppression on F-SRS was observed with a negative ${\psi}_2$.

    2 Experimental setup

    The experiment was performed with the 200 TW Ti:sapphire laser system at Shanghai Jiao Tong University[30]. The schematic setup is shown in Figure 1(a). The main laser beam was focused by an F/4 off-axis parabola (OAP) mirror to a spot of 6 μm in diameter, containing approximately 25% of the laser energy. The laser has a central wavelength of ${\lambda}_0$ = 800 nm with a bandwidth of 70 nm at full width at half maximum (FWHM). The pulse duration, ${\tau}_{\mathrm{L}}$, is adjusted by introducing ${\psi}_2$ through an acousto-optic programmable dispersive filter, namely Dazzler[31]. In general, the temporal profile of a Gaussian pulse is given by the following:

    $$\begin{align} a(t) = {a}_0\exp \left(-\frac{t^2}{\tau^2}\right)\exp \left[i{\omega}_0t\left(1+\beta t\right)\right],\end{align}$$ 

    $$\begin{align}\tau = {\left[\left(4+\Delta {\omega}^4{\psi}_2^2\right)/\Delta {\omega}^2\right]}^{1/2},\end{align}$$ 

    $$\begin{align}\beta = \Delta {\omega}^4{\psi}_2/\left[2{\omega}_0\left(4+\Delta {\omega}^4{\psi}_2^2\right)\right],\end{align}$$ 

    where ${a}_0$ is the normalized amplitude, $\Delta \omega$ is half of the frequency bandwidth, and $\tau$ and $\beta$ represent the ${\psi}_2$-dependent laser duration and chirp, respectively. Here higher-order dispersion is not considered. From Equation (2), one can see that the pulse can be symmetrically stretched by adding negative or positive ${\psi}_2$. The instant frequency $\omega (t)$ changes linearly in time with the chirp rate $2{\omega}_0\beta$. In our experiment, ${\psi}_2$ was adjusted from –3000 to +3000 ${\mathrm{fs}}^2$. Here, ${\psi}_2 = 0$ represents no SOD and it corresponds to a transform-limited pulse with a duration of 29 fs. The positive (negative) ${\psi}_2$ denotes a positively (negatively) chirped laser pulse. The main pulse parameters at different ${\psi}_2$ are summarized in Table 1. The laser was focused on a helium gas jet target at 275 μm before the nozzle center and 1400 μm above the exit.

    (a) Schematic layout of the experimental setup. (b) Image of the typical electron density distribution and the on-axis density lineout (red solid line) with = 0. (c) The corresponding shadowgraph, where the color bar denotes the signal count in the charge-coupled device (CCD). The laser is incident from the left-hand side. Here, ps is denoted when the main laser is at μm. The interferogram and shadowgraphs were taken at ps.

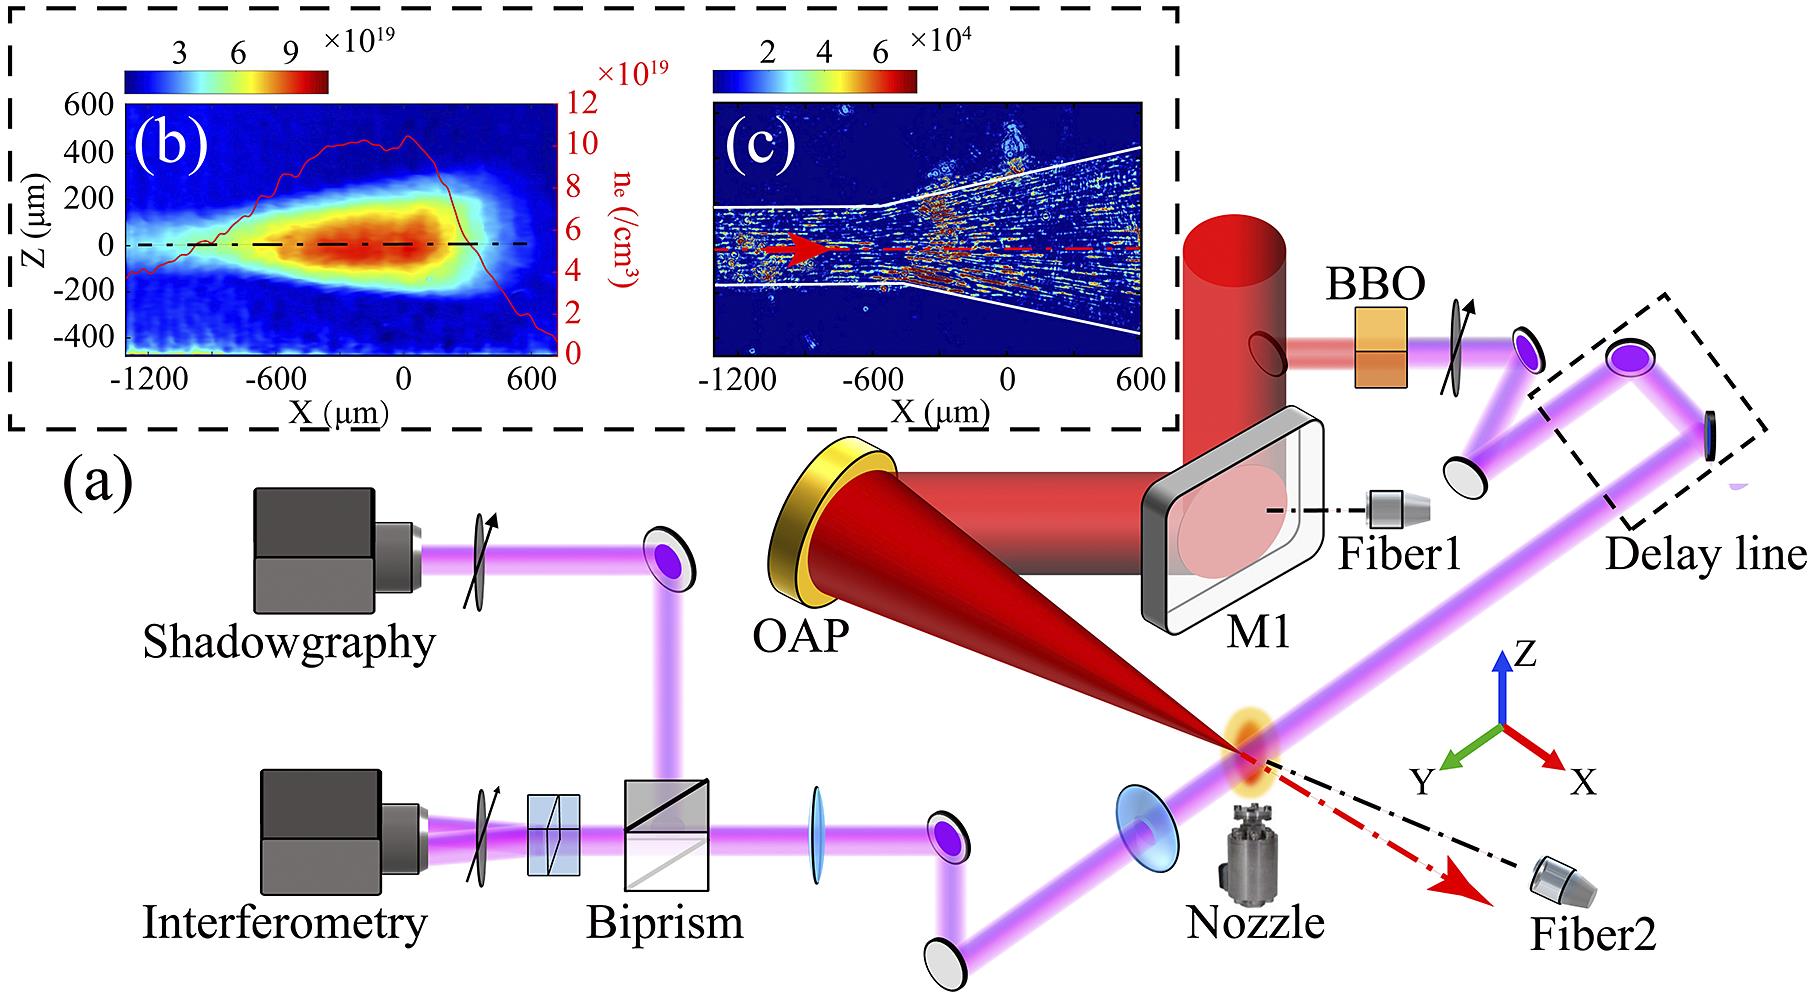
    Figure 1.(a) Schematic layout of the experimental setup. (b) Image of the typical electron density distribution and the on-axis density lineout (red solid line) with = 0. (c) The corresponding shadowgraph, where the color bar denotes the signal count in the charge-coupled device (CCD). The laser is incident from the left-hand side. Here, ps is denoted when the main laser is at μm. The interferogram and shadowgraphs were taken at ps.

    $\mid \kern-1pt\!{\psi}_2\!\kern-1pt\mid \left({\mathrm{fs}}^2\right)$0500100020003000
    ${\tau}_{\mathrm{L}}\left(\mathrm{fs}\right)$29.093.0188.4361.6550.0
    $\beta \left(\times {10}^{-5}\right)$017.018.324.512.92
    ${a}_0$5.603.122.201.581.28

    Table 1. Laser parameters for different with fixed energy (2.2 J).

    A probe pulse was split from the main pulse and frequency doubled. The timing between the probe and the main pulse was adjusted by a variable delay line as shown in Figure 1(a). After passing through the interaction region, the probe beam was further split by a biprism for interferometric and shadowgraphic measurements. Figure 1(b) shows the typical density distribution of a plasma channel from the Abel-inverted interferogram, where $z = 0$ μm represents the laser axis and $x = 0$ μm denotes the nozzle center. It shows that the plasma density along the laser axis comprises a long density up-ramp and a plateau of approximately $1\times {10}^{20}$${\mathrm{cm}}^{-3}$. Figure 1(c) displays the typical plasma channel in the shadowgraph with ${\psi}_2 = 0$. Two fiber-optic spectrometers with fiber-coupled lenses were installed to measure the optical spectra of back-scattered (Fiber 1 in Figure 1(a)) and transmitted light (Fiber 2 in Figure 1(a)). The detection ranges are 500–1200 and 200–1100 nm, respectively.

    3 Experimental results and analysis

    3.1 Influence of ${\psi}_2$ on B-SRS

    Figure 2 shows spectra of the back-scattered light under different ${\psi}_2$. It shows that the larger $\mid \kern-1pt\!{\psi}_2\!\kern-1pt\mid$ is, the stronger the back-scattering is. For both negative and positive ${\psi}_2$, the back-scattering spectra are almost identical for the same $\mid \kern-1pt\!{\psi}_2\!\kern-1pt\mid$. When $\mid \kern-1pt\!{\psi}_2\!\kern-1pt\mid \geqslant 1000$${\mathrm{fs}}^2$, clear Stokes sidebands with a regular interval were observed, indicating a substantial stronger excitation of B-SRS[32]. From the match condition, ${\omega}_0 = {\omega}_1\pm {\omega}_{\mathrm{pe}}$ (${\omega}_{\mathrm{pe}}$ is the plasma frequency), we deduce that B-SRS occurs in the density region ${n}_{\mathrm{e}}\approx 5\times {10}^{18}$${\mathrm{cm}}^{-3}$.

    The back-scattered light spectra with various (a) positive and (b) negative second-order dispersions. The absence of light within 730–870 nm is due to the total reflection of the M1 mirror in front of the collection fiber (Fiber 1 in Figure 1(a)).

    Figure 2.The back-scattered light spectra with various (a) positive and (b) negative second-order dispersions. The absence of light within 730–870 nm is due to the total reflection of the M1 mirror in front of the collection fiber (Fiber 1 in Figure 1(a)).

    To quantitatively compare the results, the red-shifted back-scattering (840–1100 nm) was integrated and plotted as a function of pulse duration ${\tau}_{\mathrm{L}}$ (shown in Figure 3). The integrated B-SRS signal has an exponential-like distribution for both negative and positive chirps. Although from Equation (2), the laser pulses with the same $\mid \kern-1pt\!{\psi}_2\!\kern-1pt\mid$ have the same pulse duration, the integrated signal is dependent on the sign of laser chirp. A larger signal was acquired with a positive chirp.

    Integrated B-SRS spectral signal (840–1100 nm) versus pulse duration. The red solid squares are experimental results of positive and the blue solid squares correspond to negative . The error bars are due to shot-to-shot fluctuations. The red dashed line presents the theoretical calculation of with nm, whereas the blue dashed line is that with nm. The inset shows the calculated with duration for nm (red solid line) and nm (blue solid line), respectively.

    Figure 3.Integrated B-SRS spectral signal (840–1100 nm) versus pulse duration. The red solid squares are experimental results of positive and the blue solid squares correspond to negative . The error bars are due to shot-to-shot fluctuations. The red dashed line presents the theoretical calculation of with nm, whereas the blue dashed line is that with nm. The inset shows the calculated with duration for nm (red solid line) and nm (blue solid line), respectively.

    In order to understand the influence of ${\psi}_2$ on B-SRS, a simple model is used. For an ultrashort laser propagating in a homogeneous plasma, the growth rate of SRS is given by the following[3]:

    $$\begin{align}{\gamma}_0\approx \frac{k_{\mathrm{epw}}}{8}{v}_{\mathrm{osc}}{\left[\frac{\omega_{\mathrm{pe}}^2}{\omega_{\mathrm{epw}}\left({\omega}_0-{\omega}_{\mathrm{epw}}\right)}\right]}^{1/2},\end{align}$$ 

    where ${v}_{\mathrm{osc}}$ is the electron oscillation velocity.

    The analysis of the Stokes sidebands has shown that B-SRS arises in the region of non-relativistic laser intensity (${I}_0\leqslant 1.0\times {10}^{18}$$\mathrm{W}/{\mathrm{cm}}^2$ for ${\psi}_2 = 0$) far before the focus. Thus, the electron oscillation velocity is estimated using ${v}_{\mathrm{osc}} = {a}_0c$, where $c$ is the speed of light. To evaluate ${\gamma}_0$, plasma temperature ${T}_{\mathrm{e}}$ is required to infer the thermal velocity ${v}_{\mathrm{th}} = \sqrt{T_{\mathrm{e}}/{m}_{\mathrm{e}}}$, which is further used to estimate the electron-plasma-wave frequency from the dispersion relation, ${\omega}_{\mathrm{epw}}^2 = {\omega}_{\mathrm{pe}}^2+3{k}_{\mathrm{epw}}^2{v}_{\mathrm{th}}^2$. The quasi-static model of above-threshold ionization (ATI) is applicable to get the plasma temperature[33,34]. In the model, the phase mismatch, $\Delta \phi$, between the electron releasing position and the crest of pump light, produces electrons with residual kinetic energy $\varepsilon = 2{E}_{\mathrm{q}}{\mathit{\sin}}^2\Delta \phi$, where ${E}_{\mathrm{q}}$ is the electron ponderomotive potential. Over a laser cycle, the averaged ATI energy is given by the following[34]:

    $$\begin{align}\left\langle \varepsilon \right\rangle = \frac{\int_0^{\frac{\pi }{2}}2{E}_{\mathrm{q}}W(t)\mathit{\cos}{\phi}^2 \mathrm{d}\phi}{\int_0^{\frac{\pi }{2}}W(t) \mathrm{d}\phi},\end{align}$$ 

    where $W(t)$ is the tunneling ionization rate, which is dependent on the strength of the electric field ${E}_{\mathrm{l}}$ and the ionization potential ${E}_{\mathrm{i}}$ of the target ion[35]. Then, ${T}_{\mathrm{e}}$ could be calculated by ${T}_{\mathrm{e}}\sim \frac{2}{3Z}\sum \left\langle {\varepsilon}_{\mathrm{i}}\right\rangle$. For a helium target, ${E}_{\mathrm{i}}$ is 13.6 and 54.4 eV to generate ${\mathrm{He}}^{+}$ and ${\mathrm{He}}^{2+}$, respectively. However, we ignore the contribution of ${\mathrm{He}}^{+}$ to ${T}_{\mathrm{e}}$ since ${\mathrm{He}}^{+}$ could be generated by the amplified spontaneous emission instead of the main pulse.

    As SRS develops in the rising edge of the laser pulse, where different wavelength components are contained, the chirp effect is straightforward. To simplify the estimation and investigate the effect of the laser wavelength on SRS growth, two cases with different single wavelengths, simulating the positive and negative chirps, were used to calculate the growth rates. We take ${\lambda}_0 = $ 835 and 765 nm, corresponding to our laser bandwidth, for cases of positive and negative ${\psi}_2$, respectively.

    The inset in Figure 3 shows the growth rate as a function of pulse duration. Here, ${\gamma}_0$ decreases with ${\tau}_{\mathrm{L}}$ and follows the scale of $\sim 1/\sqrt{\tau_{\mathrm{L}}}$. It is 8.2$\%$ higher for long-wavelength laser excitation, as ${a}_0$ is correlated with the laser wavelength. Based on the calculation, the total gain of B-SRS could be estimated by $G\approx \exp \left({\gamma}_0{\tau}_{\mathrm{g}}\right)$ with growth time ${\tau}_{\mathrm{g}}$. The best fit of the measurements is obtained with ${\tau}_{\mathrm{g}} = 0.75{\tau}_{\mathrm{L}}$ and plotted in Figure 3. This confirmed the earlier studies that B-SRS is excited at the pulse front[6,21]. Interestingly, the crude estimation gives a similar growth time, which is shorter than the pulse duration. The growth of B-SRS with $\mid \kern-1pt\!{\psi}_2\!\kern-1pt\mid$ scales as $G\approx \exp \left({\gamma}_0{\tau}_{\mathrm{g}}\right)\propto \exp \left(\sqrt{\tau_{\mathrm{L}}}\right)$.

    3.2 Influence of ${\psi}_2$ on S-SRS

    Figure 4 shows shadowgraphs of laser-produced plasma with different ${\psi}_2$. Filamentary structures were observed originating from the edge of the plasma channel due to the ionization of neutral atoms by side-scattered light[8,36,37]. The side-filamentation is more noticeable, with a higher $\mid \kern-1pt\!{\psi}_2\!\kern-1pt\mid$ occurring both in upward and downward directions. It is absent with ${\psi}_2 = 0$${\mathrm{fs}}^2$(shown in Figure 1(c)). The filaments occupy a larger spatial region and have a longer length with a higher $\mid \kern-1pt\!{\psi}_2\!\kern-1pt\mid$, regardless of the sign of the chirp. Figure 5 plots the typical transverse profiles for ${\psi}_2 = 0$ and ${\psi}_2 = +500$${\mathrm{fs}}^2$ at the different spatial positions. The density profiles are quasi-Gaussian distribution in the transverse direction, which gives rise to the observed beam divergence (marked by the white solid lines in Figures 1(c) and 4). One should notice that the transverse density profiles are almost the same for ${\psi}_2 = 0$ and ${\psi}_2 = +500$${\mathrm{fs}}^2$, but the side-scattering was absent for ${\psi}_2 = 0$. This suggests the side-scattering could not be due to the beam divergence but rather the S-SRS.

    Shadowgraphs showing side filaments at different second-order dispersions . (a) = +500 , (b) = +1000 , (c) = +2000 , (d) = –500 , (e) = –1000 and (f) = –2000 . The red arrows denote the filament direction at different spatial position. The white lines show the edges of the plasma channel.

    Figure 4.Shadowgraphs showing side filaments at different second-order dispersions . (a) = +500 , (b) = +1000 , (c) = +2000 , (d) = –500 , (e) = –1000 and (f) = –2000 . The red arrows denote the filament direction at different spatial position. The white lines show the edges of the plasma channel.

    The transverse plasma density profile in the cases of and . The solid lines and the dash-dot lines represent the profiles obtained at μm and μm, respectively.

    Figure 5.The transverse plasma density profile in the cases of and . The solid lines and the dash-dot lines represent the profiles obtained at μm and μm, respectively.

    The effect of ${\psi}_2$ on side-scattering can also be distinguished by comparing the length and number of side filaments. We found the difference in chirp is significant at a shorter pulse duration. For example, filamentation in the case of ${\psi}_2 = -500$${\mathrm{fs}}^2$ (Figure 4(d)) is extremely weak compared to that with ${\psi}_2 = +500$${\mathrm{fs}}^2$ (Figure 4(a)). However, for ${\psi}_2 = \pm 2000$${\mathrm{fs}}^2$ (Figures 4(c) and 4(f)), the difference between the two cases becomes indistinguishable. The group velocity dispersion induced by laser chirp could contribute to the observation. The pulse compression (for positively chirped pulse) or stretch (for negatively chirped pulse) induced by the group velocity dispersion would reinforce or suppress the Raman process. Moreover, this phenomenon is strongly dependent on the chirp rate[26,27]. A higher chirp rate has a stronger impact. Considering the chirp rate is 3.8 times larger for $\mid \kern-1pt\!{\psi}_2\!\kern-1pt\mid = 500$${\mathrm{fs}}^2$ than that for $\mid \kern-1pt\!{\psi}_2\!\kern-1pt\mid = 2000$${\mathrm{fs}}^2$ (shown in Table 1), it is reasonable to observe a significant difference for the former cases.

    In addition, with the increase of $\mid \kern-1pt\!{\psi}_2\!\kern-1pt\mid$, the lateral dimension of the plasma channel reduces as a result of reduced on-axis laser intensity due to pulse stretching. It is approximately 280 $\pm 15$ μm for $\mid \kern-1pt\!{\psi}_2\!\kern-1pt\mid = 500$${\mathrm{fs}}^2$, approximately $200\pm 15$ μm for $\mid \kern-1pt\!{\psi}_2\!\kern-1pt\mid = 1000$${\mathrm{fs}}^2$ and approximately 140 $\pm 10$ μm for $\mid \kern-1pt\!{\psi}_2\!\kern-1pt\mid = 2000$${\mathrm{fs}}^2$, respectively.

    3.3 Influence of ${\psi}_2$ on F-SRS

    Figures 6(a) and 6(b) show the transmitted spectra under positive ${\psi}_2$ and negative ${\psi}_2$, respectively. The spectra of transmitted light are mainly composed of the laser spectrum and a blue-shifted component due to the ionization-induced frequency shift[38,39]. The red-shifted spectrum is intriguingly absent. The influence of $\mid \kern-1pt\!{\psi}_2\!\kern-1pt\mid$ on F-SRS significantly differs from that on the backward and side-scattering. There is no pronounced enhancement on SRS with increasing $\mid \kern-1pt\!{\psi}_2\!\kern-1pt\mid$. For positive ${\psi}_2$, anti-Stokes sidebands emerge at ${\psi}_2 = +500$${\mathrm{fs}}^2$ and become more obvious at ${\psi}_2 = +1000$${\mathrm{fs}}^2$. A further increase in ${\psi}_2$ will not affect the intensity of anti-Stokes sidebands, while slightly modulating their intervals. Sidebands in the cases of ${\psi}_2 = +1000\ {\mathrm{fs}}^2$, ${\psi}_2 = +2000\ {\mathrm{fs}}^2$ and ${\psi}_2 = +3000$${\mathrm{fs}}^2$ have comparable signal intensity, which may suggest saturation of F-SRS at longer pulse durations.

    The spectra of transmitted light with (a) positive second-order dispersion and (b) negative second-order dispersion.

    Figure 6.The spectra of transmitted light with (a) positive second-order dispersion and (b) negative second-order dispersion.

    In addition, the laser chirp was found to have a significant impact on F-SRS. Sections 3.1and3.2 show similar features of B-SRS and S-SRS for both negative and positive chirps. For F-SRS, however, the transmitted optical spectrum depends significantly on the sign of the laser chirp. As shown in Figure 6(b), in all cases with a negative laser chirp, the spectra are similar to that with ${\psi}_2 = +500$${\mathrm{fs}}^2$ in Figure 6(a). There is no distinguishable sign of anti-Stokes sidebands in F-SRS with a negative chirp, even though the pulse duration is stretched to 550 fs (${\psi}_2 = -3000$${\mathrm{fs}}^2$). This indicates that F-SRS is strongly suppressed with a negatively chirped pulse. This observation is consistent with theoretical estimation[26], where a laser with 12$\%$ bandwidth can eliminate Raman forward scattering.

    3.4 Side-scattering angle dependence on ${\psi}_2$

    As shown in Figure 4 , there is a trend that the inclined angle of filaments relative to the laser axis gets smaller with the laser propagation (denoted by red arrows). In Figure 7, we plot the angles of both upward and downward filaments as a function of spatial position for different ${\psi}_2$. It shows that a relatively larger side-scattering angle is observed with a higher $\mid \kern-1pt\!{\psi}_2\!\kern-1pt\mid$. At $x = -1150$ μm, for instance, the angle increases from $31.0^{\circ }\pm 4^{\circ }$ for $\mid \kern-1pt\!{\psi}_2\!\kern-1pt\mid = 500$${\mathrm{fs}}^2$ to $41.0^{\circ }\pm 4^{\circ }$ for $\mid \kern-1pt\!{\psi}_2\!\kern-1pt\mid = 2000$${\mathrm{fs}}^2$. In Figures 7(b) and 7(c), the upward and downward side-scattering angles under positive and negative chirps are compared. The chirp effect is negligible, since the filament angles follow the same trends for both negative and positive ${\psi}_2$. Meanwhile, we note that the side-scatterings are asymmetric where the downward filaments have angles several degrees larger than that in the upward direction at the same spatial position. Similar observation has been reported by Matsuoka et al.[8]; however, the angular variation and underlying physics remain elusive.

    The side-scattering angle at different spatial positions with (a) , (b) and (c) . Orange circles and green squares correspond to the measurements of the upward scattering angle with positive and negative , respectively. Blue triangles are the measurements of the downward scattering angle with negative . The orange (blue) dashed line is the calculation based on the maximum spatial growth rate with ().

    Figure 7.The side-scattering angle at different spatial positions with (a) , (b) and (c) . Orange circles and green squares correspond to the measurements of the upward scattering angle with positive and negative , respectively. Blue triangles are the measurements of the downward scattering angle with negative . The orange (blue) dashed line is the calculation based on the maximum spatial growth rate with ().

    To explain the spatially-dependent scattering angles, a model incorporating the growth of Raman scattering and the energy damping processes was used[2]. The energy damping rate of plasma waves is expressed as follows[2]:

    $$\begin{align} \begin{array}{ll}{\Gamma}_{\mathrm{p}} = \!\!\!\!\!\!\!\!& {\left(\dfrac{\pi }{8}\right)}^{1/2}\dfrac{\omega_{\mathrm{pe}}}{{\left({k}_{\mathrm{p}}{\lambda}_{\mathrm{D}}\right)}^3}\mathit{\exp}\left[-\dfrac{1}{2}{\left({k}_{\mathrm{p}}{\lambda}_{\mathrm{D}}\right)}^{-2}-\dfrac{3}{2}\right]\\[6pt] {}& +{\left({\omega}_{\mathrm{pe}}/{\omega}_{\mathrm{epw}}\right)}^2{v}_{\mathrm{ei}},\end{array}\end{align}$$ 

    where ${\lambda}_{\mathrm{D}} = {v}_{\mathrm{th}}/{\omega}_{\mathrm{pe}}$ is the Debye length and ${v}_{\mathrm{ei}}$ is the electron–ion collision frequency. The first term on the right-hand side in Equation (6) represents the Landau damping and the second term is the inverse bremsstrahlung absorption. The inverse bremsstrahlung absorption also causes an energy dissipation of the EM wave, giving ${\Gamma}_{\mathrm{s}} = {\left({\omega}_{\mathrm{pe}}/{\omega}_1\right)}^2{v}_{\mathrm{ei}}$. Combining the two damping processes, the spatial growth rate of SRS is given as follows[2]:

    $$\begin{align}\kern-5pt\kappa = {\left[\frac{\gamma_0^2}{v_{1\mathrm{x}}{v}_{2\mathrm{x}}}+\frac{1}{4}{\left(\frac{\Gamma_{\mathrm{s}}}{v_{1\mathrm{x}}}-\frac{\Gamma_{\mathrm{p}}}{v_{2\mathrm{x}}}\right)}^2\right]}^{1/2}-\frac{1}{2}\left(\frac{\Gamma_{\mathrm{s}}}{v_{1\mathrm{x}}}+\frac{\Gamma_{\mathrm{p}}}{v_{2\mathrm{x}}}\right),\end{align}$$ 

    where ${v}_{1\mathrm{x}}$ and ${v}_{2\mathrm{x}}$ represent the group velocity of the scattered light and the plasma wave, respectively. They are expressed as follows:

    $$\begin{align}{v}_{1\mathrm{x}} = {k}_1{c}^2 \cos\theta /{\omega}_1,\end{align}$$ 

    $$\begin{align}{v}_{2\mathrm{x}} = 3\left({k}_0-{k}_1 \cos\theta \right)\left({v}_{\mathrm{th}}^2/{\omega}_{\mathrm{pe}}\right),\end{align}$$ 

    where $\theta$ is the angle between the scattered light and the pump light. According to Equations (7)(9), the spatial growth rate intrinsically depends on $\theta$.

    Since side filaments were found to originate from the plasma channel edge, the local plasma density ${n}_{\mathrm{e}}$ was used in calculating the growth rate $\kappa$. Deduced from the interferogram, ${n}_{\mathrm{e}}$ is $\left(1.8\pm 0.3\right)\times {10}^{19}$${\mathrm{cm}}^{-3}$ at the upper edge and $\left(2.4\pm 0.3\right)\times {10}^{19}\ {\mathrm{cm}}^{-3}$ at the lower edge. Considering the laser focusing geometry, the laser intensity increases with the propagation. Plasma temperature ${T}_{\mathrm{e}}$ is estimated by the ATI ionization model described above.

    Figure 8(a) shows the calculated plasma temperature distribution in the spatial position for different $\mid \kern-1pt\!{\psi}_2\!\kern-1pt\mid$. Here, ${T}_{\mathrm{e}}$ increases with the laser propagation and decreases with $\mid \kern-1pt\!{\psi}_2\!\kern-1pt\mid$. The calculated angular-dependent spatial growth rate $\kappa$ is plotted in Figure 8(b). It shows that S-SRS has the largest growth rate along a cone angle near the forward direction[2,40]. The cone angle reduces with an increase in ${T}_{\mathrm{e}}$ or a decrease in ${n}_{\mathrm{e}}$. We evaluated the influence of chirp on the spatial growth rate by changing the laser wavelength ${\lambda}_0$. The angle with maximum growth rate ${\theta}_{\mathrm{m}}$ is weakly dependent on ${\lambda}_0$. For example, at $x = -1300$ μm, ${\theta}_{\mathrm{m}}$ varies from ${29.6}^{\circ }$ to ${30.1}^{\circ }$ when ${\lambda}_0$ changes from 760 to 840 nm. The insensitivity of the scattering angle to the laser wavelength is consistent with our observations. Thus, the effect of chirp on the angle is trivial.

    (a) The plasma temperature for different . (b) The typical angular distributions of the spatial growth rate that correspond to the black crosses in (a). LD is for , and HD for .

    Figure 8.(a) The plasma temperature for different . (b) The typical angular distributions of the spatial growth rate that correspond to the black crosses in (a). LD is for , and HD for .

    Since filaments should be most evident near ${\theta}_{\mathrm{m}}$, we plot ${\theta}_{\mathrm{m}}$ as a function of spatial position (shown in Figures 5(a)–5(c)). The calculations successfully reproduce the measurements in all cases, which suggest that the reduced filament angle is mainly due to the increased ${T}_{\mathrm{e}}$. During the laser propagation and focusing, the spot size decreases and ${T}_{\mathrm{e}}$ increases. Similarly, a larger ${\theta}_{\mathrm{m}}$ is expected for a higher $\mid \kern-1pt\!{\psi}_2\!\kern-1pt\mid$, as the longer pulse duration will lower the temperature ${T}_{\mathrm{e}}$. The measured asymmetric side-scattering in the upward and downward directions is evidently attributed to the ${n}_{\mathrm{e}}$ difference of plasma channel edges in the transverse direction.

    4 Summary

    In summary, we have reported a detailed study on the influence of the SOD, ${\psi}_2$, on SRS instability. The SRS is characterized in the backward, sideways, and forward directions. Evident excitation of SRS in all directions was observed when ${\psi}_2$ is introduced. B-SRS and S-SRS grow with $\mid \kern-1pt\!{\psi}_2\!\kern-1pt\mid$, and a stronger signal was measured with a positive ${\psi}_2$. However, there is a suppression of F-SRS when a negatively chirped pulse is used. Supported by a theoretical model, the spatially-dependent angle distribution of side-scattering is investigated. The side-scattering angle is defined by the plasma temperature and density and is insensitive to the laser chirp.

    References

    [1] C. S. Liu, M. N. Rosenbluth, R. B. White. Phys. Fluids, 17, 1211(1974).

    [2] S. C. Wilks, W. L. Kruer, K. Estabrook, A. B. Langdon. Phys. Fluids B, 4, 2794(1992).

    [3] S. C. Wilks, W. L. Kruer, E. A. Williams, P. Amendt, D. C. Eder. Phys. Plasmas, 2, 274(1995).

    [4] T. M. Antonsen, P. Mora. Phys. Rev. Lett., 69, 2204(1992).

    [5] K. Krushelnick, A. Ting, H. R. Burris, A. Fisher, C. Manka, E. Esarey. Phys. Rev. Lett., 75, 3681(1995).

    [6] K.-C. Tzeng, W. B. Mori, C. D. Decker. Phys. Rev. Lett., 76, 3332(1996).

    [7] A. G. R. Thomas, S. P. D. Mangles, Z. Najmudin, M. C. Kaluza, C. D. Murphy, K. Krushelnick. Phys. Rev. Lett., 98, 054802(2007).

    [8] T. Matsuoka, C. Mcguffey, P. G. Cummings, Y. Horovitz, F. Dollar, V. Chvykov, G. Kalintchenko, P. Rousseau, V. Yanovsky, S. S. Bulanov, A. G. R. Thomas, A. Maksimchuk, K. Krushelnick. Phys. Rev. Lett., 105, 034801(2010).

    [9] E. Esarey, C. B. Schroeder, W. P. Leemans. Rev. Mod. Phys., 81, 1229(2009).

    [10] T. Nakamura, S. V. Bulanov, T. Z. Esirkepov, M. Kando. Phys. Rev. Lett., 105, 135002(2010).

    [11] M. H. Helle, D. F. Gordon, D. Kaganovich, Y. Chen, J. P. Palastro, A. Ting. Phys. Rev. Lett., 117, 165001(2016).

    [12] O. Silva, M. Marti, J. R. Davies, R. A. Fonseca, C. Ren, F. S. Tsung, W. B. Mori. Phys. Rev. Lett., 92, 015002(2004).

    [13] S. Corde, K. T. Phuoc, G. Lambert, R. Fitour, V. Malka, A. Rousse, A. Beck, E. Lefebvre. Rev. Mod. Phys., 85(2013).

    [14] G. B. Zhang, M. Chen, X. H. Yang, F. Liu, S. M. Weng, Y. Y. Ma, D. B. Zou, T. P. Yu, F. Q. Shao, Z. M. Sheng. Opt. Express, 28, 29927(2013).

    [15] A. Modena, Z. Najmudin, A. E. Dangor, C. E. Clayton, K. A. Marsh, C. Joshi, V. Malka, C. B. Darrow, C. Danson, D. Neely, F. N. Walsh. Nature, 377, 606(1995).

    [16] N. Hafz, M. S. Hur, G. H. Kim, C. Kim, I. S. Ko, H. Suk. Phys. Rev. E, 73, 016405(2006).

    [17] A. E. Hussein, J. Ludwig, K. Behm, Y. Horovitz, P.-E. Masson-Laborde, V. Chvykov, A. Maksimchuk, T. Matsuoka, C. McGuffey, V. Yanovsky, W. Rozmus, K. Krushelnick. New J. Phys., 20, 073039(2018).

    [18] D. Kaganovich, B. Hafizi, J. P. Palastro, A. Ting, M. H. Helle, Y.-H. Chen, T. G. Jones, D. F. Gordon. Phys. Plasmas, 23, 123104(2016).

    [19] H. Jang, M. S. Hur, J. M. Lee, M. H. Cho, W. Namkung, H. Suk. Appl. Phys. Lett., 93, 071506(2008).

    [20] W. P. Leemans, P. Catravas, E. Esarey, C. G. R. Geddes, C. Toth, R. Trines, C. B. Schroeder, B. A. Shadwick, J. van Tilborg, J. Faure. Phys. Rev. Lett., 89, 174802(2002).

    [21] J. Faure, J.-R. Marquès, V. Malka, F. Amiranoff, Z. Najmudin, B. Walton, J.-P. Rousseau, S. Ranc, A. Solodov, P. Mora. Phys. Rev. E, 63, 065401(2001).

    [22] T.-W. Yau, C.-J. Hsu, H.-H. Chu, Y.-H. Chen, C.-H. Lee, J. Wang, S.-Y. Chen. Phys. Plasmas, 9, 391(2002).

    [23] B. S. Rao, A. Moorti, P. A. Naik, P. D. Gupta. Phys. Rev. ST Accel. Beams, 16, 091301(2013).

    [24] A. Permogorov, G. Cantono, D. Guenot, A. Persson, C.-G. Wahlström. Sci. Rep., 12, 3031(2022).

    [25] H. T. Kim, V. B. Pathak, K. H. Pae, A. Lifschitz, F. Sylla, J. H. Shin, C. Hojbota, S. K. Lee, J. H. Sung, H. W. Lee, E. Guillaume, C. Thaury, K. Nakajima, J. Vieira, L. O. Silva, V. Malka, C. H. Nam. Sci. Rep., 7, 10203(2017).

    [26] E. S. Dodd, D. Umstadter. Phys. Plasmas, 8, 3531(2001).

    [27] V. B. Pathak, J. Vieira, R. A. Fonseca, L. O. Silva. New J. Phys., 14, 023057(2012).

    [28] C. B. Schroeder, E. Esarey, B. A. Shadwick, W. P. Leemans. Phys. Plasmas, 10, 285(2003).

    [29] N. Pathak, A. Zhidkov, T. Hosokai, R. Kodama. Phys. Plasmas, 25, 013119(2018).

    [30] Y. Fang, T. P. Yu, X. L. Ge, S. Yang, W. Q. Wei, T. Yuan, F. Liu, M. Chen, J. Q. Liu, Y. T. Li, X. H. Yuan, Z. M. Sheng, J. Zhang. Plasma. Phys. Control. F, 58, 45025(2016).

    [31] P. Tournois. Opt. Commun., 140, 245(1997).

    [32] C. A. Coverdale, C. B. Darrow, C. D. Decker, W. B. Mori, K.-C. Tzeng, K. A. Marsh, C. E. Clayton, C. Joshi. Phys. Rev. Lett., 74, 4659(1995).

    [33] P. B. Corkum, N. H. Burnett, F. Brunel. Phys. Rev. Lett., 62, 1259(1989).

    [34] N. H. Burnett, P. B. Corkum. J. Opt. Soc. Am. B, 6, 1195(1989).

    [35] M. V. Ammosov, N. B. Delone, V. P. Krainov. Sov. Phys. JETP, 64, 1191(1986).

    [36] F. Sylla, A. Flacco, S. Kahaly, M. Veltcheva, A. Lifschitz, G. Sanchez-Arriaga, E. Lefebvre, V. Malka. Phys. Rev. Lett., 108, 115003(2012).

    [37] A. K. Arunachalam, M. B. Schwab, A. Sävert, M. C. Kaluza. New J. Phys., 20, 003027(2018).

    [38] W. M. Wood, C. W. Siders, M. C. Downer. Phys. Rev. Lett., 67, 3523(1991).

    [39] J. K. Koga, N. Naumova, M. Kando, L. N. Tsintsadze, K. Nakajima, S. V. Bulanov, H. Dewa, H. Kotaki, T. Tajima. Phys. Plasmas, 7, 5223(2000).

    [40] A. Higginson, S. Zhang, M. Bailly-Grandvaux, C. McGuffey, K. Bhutwala, B. J. Winjum, J. Strehlow, B. Edghill, M. Dozières, F. S. Tsung, R. Lee, S. Andrews, S. J. Spencer, N. Lemos, F. Albert, P. King, M. S. Wei, W. B. Mori, M. J.-E Manuel, F. N. Beg. Phys. Rev. E, 103, 033203(2021).

    Yanqing Deng, Dongning Yue, Mufei Luo, Xu Zhao, Yaojun Li, Xulei Ge, Feng Liu, Suming Weng, Min Chen, Xiaohui Yuan, Jie Zhang. Effects of second-order dispersion of ultrashort laser pulse on stimulated Raman scattering[J]. High Power Laser Science and Engineering, 2022, 10(6): 06000e39
    Download Citation