• Advanced Photonics Nexus
  • Vol. 2, Issue 1, 016008 (2023)
Mengyun Hu1、2、3, Fangfang Li1、2, Shencheng Shi1、2, Yu Qiao1、2, Jinman Ge4, Xiaojun Li4, and Heping Zeng1、2、5、6、*
Author Affiliations
  • 1East China Normal University, State Key Laboratory of Precision Spectroscopy, Shanghai, China
  • 2Chongqing Institute of East China Normal University, Chongqing Key Laboratory of Precision Optics, Chongqing, China
  • 3University of Shanghai for Science and Technology, School of Optical-Electrical and Computer Engineering, Engineering Research Center of Optical Instrument and System (Ministry of Education), Shanghai Key Laboratory of Modern Optical System, Shanghai, China
  • 4China Academy of Space Technology (Xi’an), National Key Laboratory of Science and Technology on Space Microwave, Xi’an, Shaanxi, China
  • 5Shanghai Research Center for Quantum Sciences, Shanghai, China
  • 6Chongqing Institute for Brain and Intelligence, Guangyang Bay Laboratory, Chongqing, China
  • show less
    DOI: 10.1117/1.APN.2.1.016008 Cite this Article Set citation alerts
    Mengyun Hu, Fangfang Li, Shencheng Shi, Yu Qiao, Jinman Ge, Xiaojun Li, Heping Zeng. Detection of trace metals in water by filament- and plasma-grating-induced breakdown spectroscopy[J]. Advanced Photonics Nexus, 2023, 2(1): 016008 Copy Citation Text show less
    (a) Photo of plasma-grating excited fluid jet stream. (b) Schematic of the spatial configuration of three filaments generated by pulses A, B, and C. The parallel structure represents plasma gratings generated by the nonlinear interactions of coplanar filaments A, B, and/or C. (c) Schematic of the top view of the plasma grating interacting with the fluid jet.
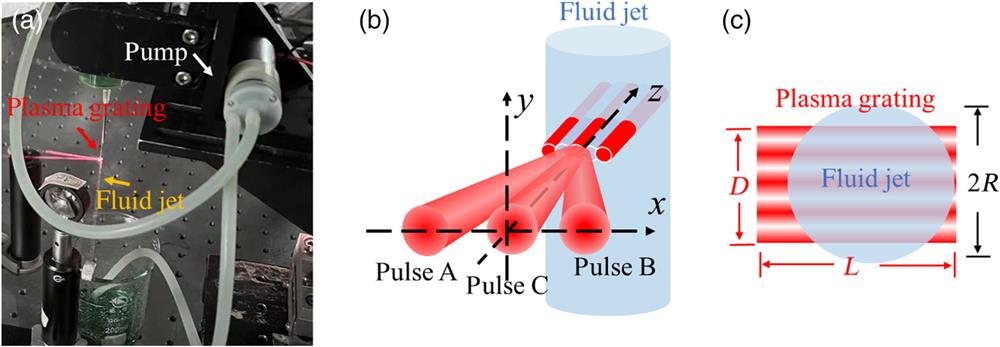
    Fig. 1. (a) Photo of plasma-grating excited fluid jet stream. (b) Schematic of the spatial configuration of three filaments generated by pulses A, B, and C. The parallel structure represents plasma gratings generated by the nonlinear interactions of coplanar filaments A, B, and/or C. (c) Schematic of the top view of the plasma grating interacting with the fluid jet.
    Time evolution of a typical F-GIBS spectrum: evolution of (a) a typical F-GIBS with the detection delay and (b) the intensity and SNR of Cu I 324.7 nm excited by F-GIBS.
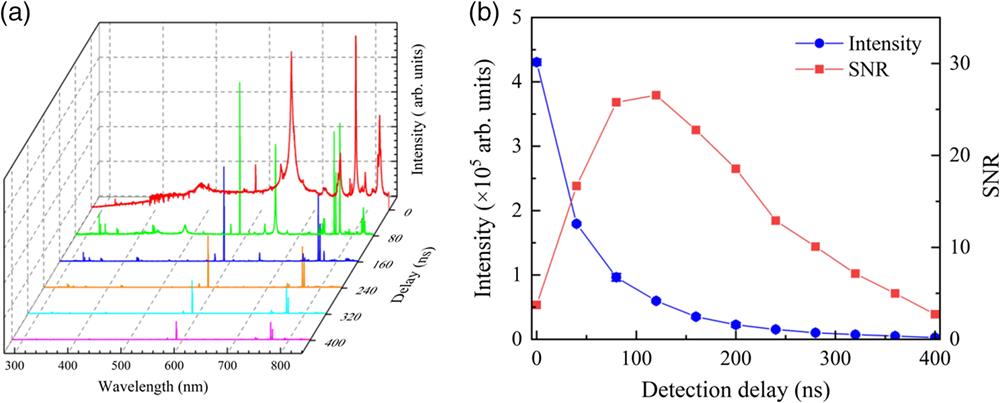
    Fig. 2. Time evolution of a typical F-GIBS spectrum: evolution of (a) a typical F-GIBS with the detection delay and (b) the intensity and SNR of Cu I 324.7 nm excited by F-GIBS.
    F-GIBS signals of Cu I 324.7, Cr I 425.4, and Na I 588.9 nm attained under different interpulse delays.
    Fig. 3. F-GIBS signals of Cu I 324.7, Cr I 425.4, and Na I 588.9 nm attained under different interpulse delays.
    Top view of the noncollinear interaction area between pulses A and B to create plasma gratings (a) without and (b) with the third filament (pulse C) entering the plasma grating at 50 ps delay, respectively. The plasma grating fluorescence photos are shown in the inset pictures.
    Fig. 4. Top view of the noncollinear interaction area between pulses A and B to create plasma gratings (a) without and (b) with the third filament (pulse C) entering the plasma grating at 50 ps delay, respectively. The plasma grating fluorescence photos are shown in the inset pictures.
    Top view of the noncollinear interaction area between the ahead pulse C (−50 ps delay) and plasma grating inducing by pulses A and B.
    Fig. 5. Top view of the noncollinear interaction area between the ahead pulse C (50  ps delay) and plasma grating inducing by pulses A and B.
    Top view of the noncollinear coplanar filament interaction area as the three filaments are synchronized.
    Fig. 6. Top view of the noncollinear coplanar filament interaction area as the three filaments are synchronized.
    Comparison of FIBS, GIBS, and F-GIBS at different delays (0 and ±50 ps) in aqueous solutions for spectral lines of (a) Cu, (b) Cr, (c) H, and (d) Na elements.
    Fig. 7. Comparison of FIBS, GIBS, and F-GIBS at different delays (0 and ±50  ps) in aqueous solutions for spectral lines of (a) Cu, (b) Cr, (c) H, and (d) Na elements.
    LineE1 to E2 (eV)EGIBSEF-GIBS
    0 ps50 ps−50 ps
    Cu I 324.7 nm0.000 to 3.8163.1926.3870.3677.71
    Cu I 327.4 nm0.000 to 3.7855.1128.3375.3187.62
    Cr I 425.4 nm0.000 to 2.91322.0392.80145.77174.98
    Cr I 427.4 nm3.086 to 5.98618.0894.72154.52177.99
    Cr I 428.9 nm0.000 to 2.88920.5999.11152.71195.18
    Na I 588.9 nm0.000 to 2.1044.516.758.8712.44
    Na I 589.5 nm0.000 to 2.1023.585.917.1911.21
    Table 1. The enhancement factors of various spectral lines attained by GIBS and F-GIBS excitation protocols versus FIBS.
    Mengyun Hu, Fangfang Li, Shencheng Shi, Yu Qiao, Jinman Ge, Xiaojun Li, Heping Zeng. Detection of trace metals in water by filament- and plasma-grating-induced breakdown spectroscopy[J]. Advanced Photonics Nexus, 2023, 2(1): 016008
    Download Citation