
Xiao-Yuan LIU, Bao-Dan LIU, Ya-Nan JIANG, Ke WANG, Yang ZHOU, Bing YANG, Xing-Lai ZHANG, Xin JIANG, [in Chinese], [in Chinese], [in Chinese], [in Chinese], [in Chinese], [in Chinese], [in Chinese], [in Chinese]. In-situ Synthesis of Perovskite SrTiO3 Nanostructures with Modified Morphology and Tunable Optical Absorption Property[J]. Journal of Inorganic Materials, 2019, 34(1): 65
- Journal of Inorganic Materials
- Vol. 34, Issue 1, 65 (2019)
. XRD patterns of SrTiO3 samples prepared under different hydrothermal conditions
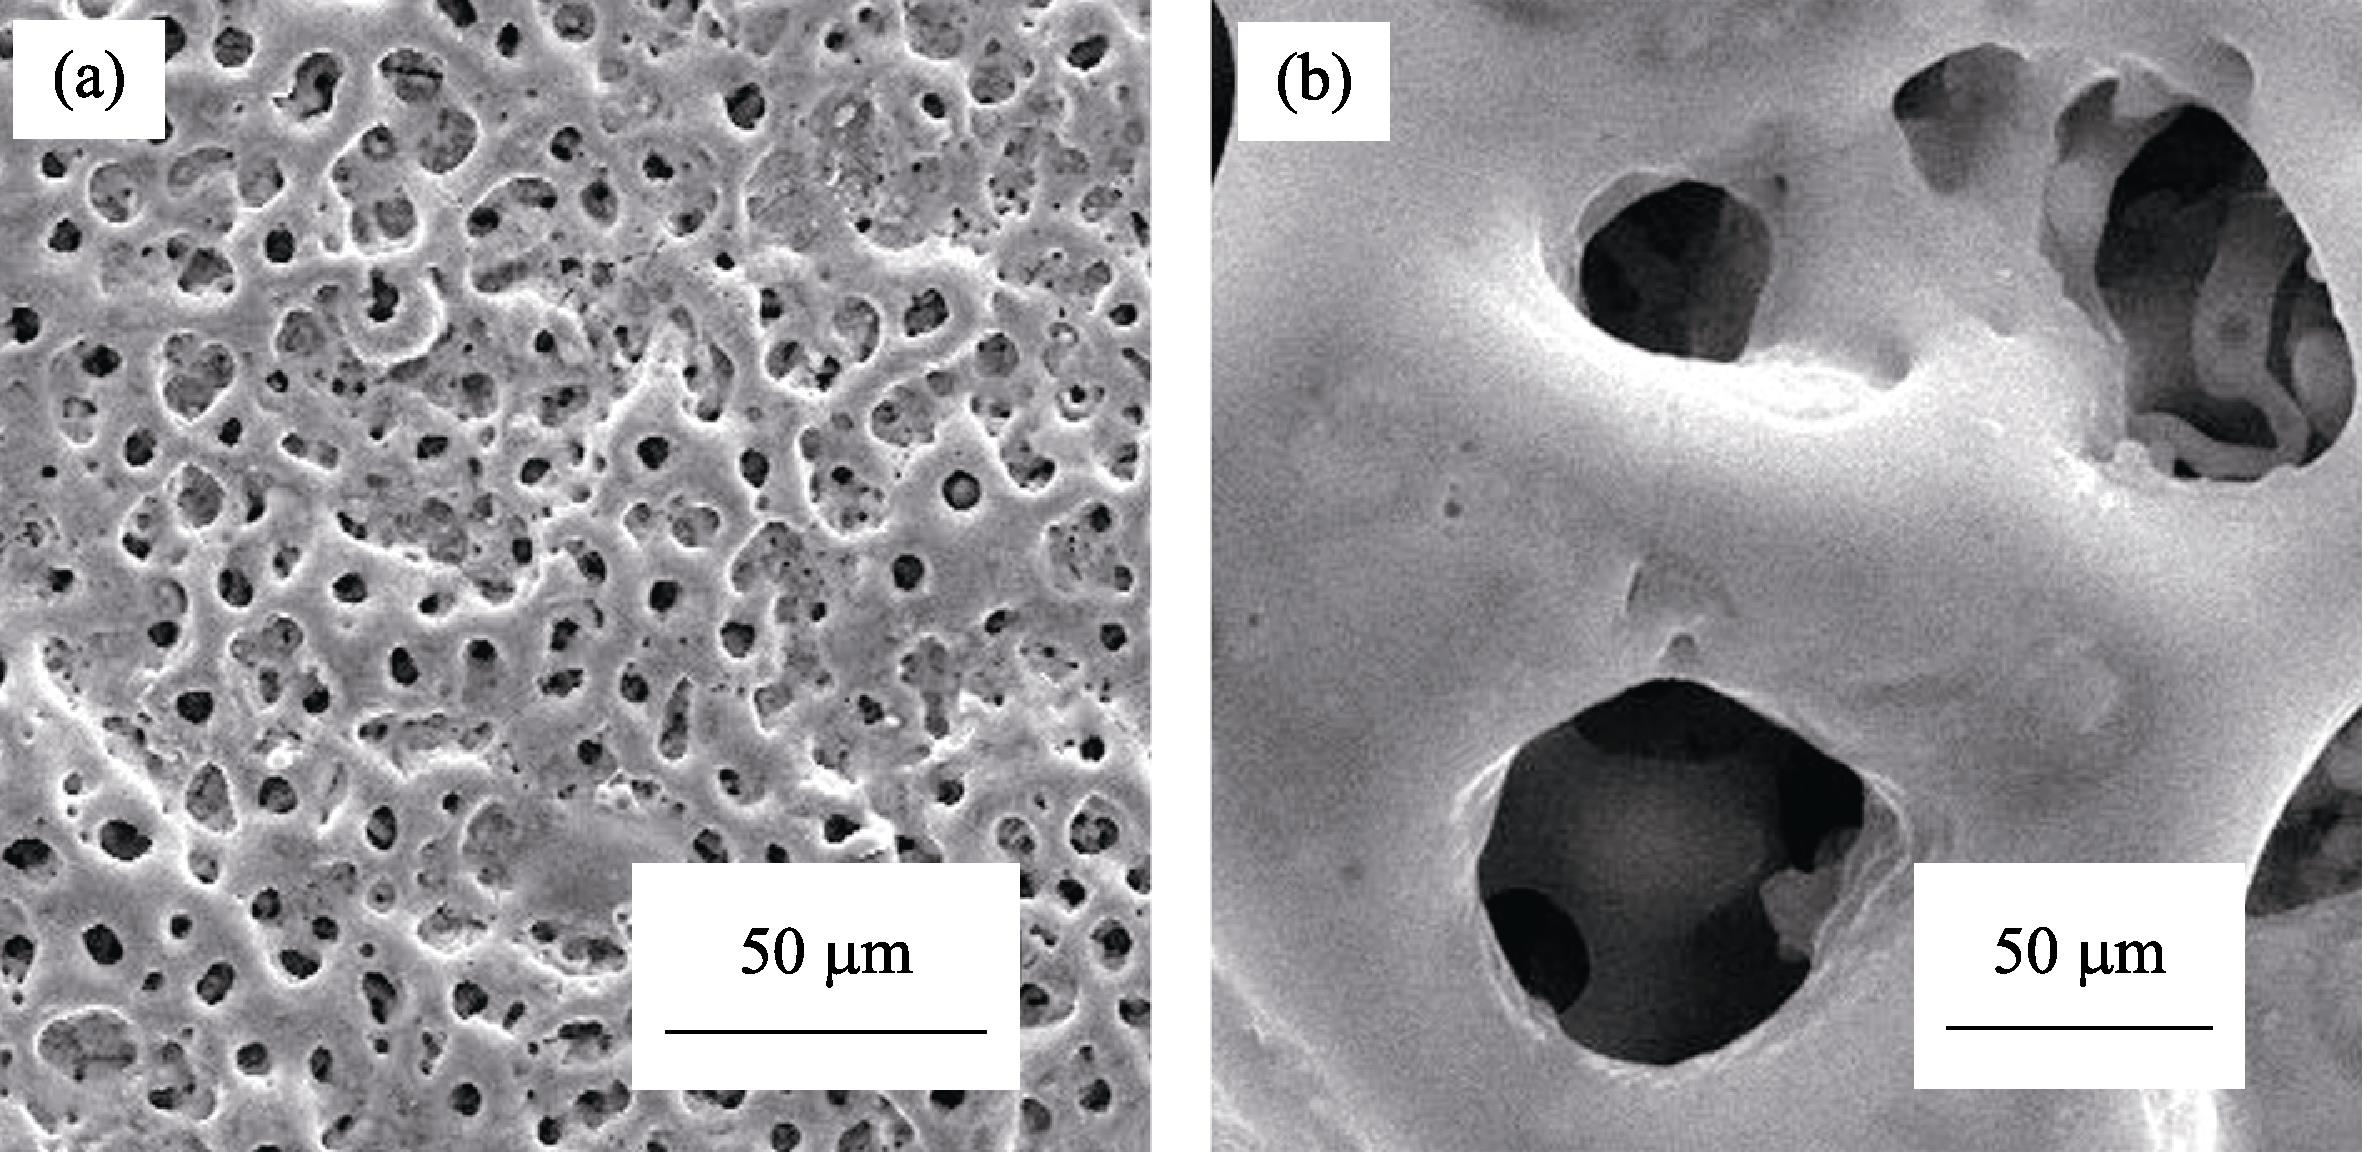
. SEM images of PEO film
. (a,c) SEM image and TEM bright field image of SrTiO3 microcubes; (b) Crystallographic model of cube-like SrTiO3 nanostructure; (d,e) HRTEM image and FFT pattern of SrTiO3 microcubes
. (a, c) X-ray diffraction topography (XRT) images of PEO film surface morphology and (b, d) cross section imagesTable S1 EDS results of PEO film prepared in high Sr concentration electrolyte
(HSCE) and low Sr concentration electrolyte (LSCE)
(HSCE) and low Sr concentration electrolyte (LSCE)
. (a,c) SEM image and TEM bright field image of Sr1-δ TiO3 nanosheets; (b) Crystallographic model of sheet-like Sr1-δ TiO3; (d,e) HRTEM image and FFT pattern of Sr1-δ TiO3 nanosheets
. XRD patterns of PEO films prepared under different conditions LSCE, 7 min PEO treating time; LSCE, 12 min PEO treating time, HSCE, 7 min PEO treating time and HSCE, 12 min PEO treating time
. XPS spectra of (a) Sr3d, (b) Ti2p and (c) O1s of Sr1-δ TiO3 nanosheets prepared under 1.0 mol/L NaOH solution for 8 h
. SEM images of SrTiO3 microcubes obtained on PEO film under HSCE and in 0.5 mol/L NaOH with different durations (a) 180℃, 1 h; (b) 180℃, 4 h; (c) 180℃, 6 h; (d) 180℃, 8 h
. Schematic diagram describing the formation process of SrTiO3 microcubes and Sr1-δ TiO3 nanosheets
. Surface morphology of PEO film after hydrothermal treating (without NaOH, 180℃, 8 h)
. SEM images of SrTiO3 microcubes obtained on PEO film under HSCE and in 1.0 mol/L NaOH with different durations (a) 180℃, 0.5 h; (b) 180℃, 1 h; (c) 180℃, 2 h; (d) 180℃, 8 h
. UV-Vis spectra of PEO film, SrTiO3 microcubes and Sr1-δ TiO3 nanosheets under different hydrothermal conditions
. SEM images of SrTiO3 microcubes obtained on PEO film under HSCE and in 1.5 mol/L NaOH with different durations (a) 180℃, 4 h; (b) 180℃, 6 h; (c) 180℃, 8 h
. SEM images of Sr1-δ TiO3 nanosheets obtained on PEO film under LSCE and in 1.0 mol/L NaOH with different durations (a) 180℃, 0.5 h; (b) 180℃, 1 h; (c) 180℃, 2 h; (d) 180℃, 4 h; (e) 180℃, 8 h
. SEM images of Sr1-δ TiO3 nanosheets obtained on PEO film under LSCE and in 0.5 mol/L NaOH with different durations (a) 180℃, 2 h; (b) 180℃, 4 h; (c) 180℃, 8 h
. SEM images of Sr1-δ TiO3 nanosheets obtained on PEO film under LSCE and in 1.5 mol/L NaOH with different durations (a) 180℃, 2 h; (b) 180℃, 4 h; (c) 180℃, 8 h
|
Table 1. EDS results of PEO film prepared in high Sr concentration electrolyte (HSCE) and low Sr concentration electrolyte (LSCE)
|
Table 2. EDS results of SrTiO3 microcubes and Sr1-δ TiO3 nanosheets
|
Table 3. XPS element analysis of Sr1-δ TiO3 nanosheets

Set citation alerts for the article
Please enter your email address
© Copyright 2018-2021 | Chinese Laser Press. All Rights Reserved 沪ICP备15018463号-20