• Photonics Research
  • Vol. 8, Issue 11, 1725 (2020)
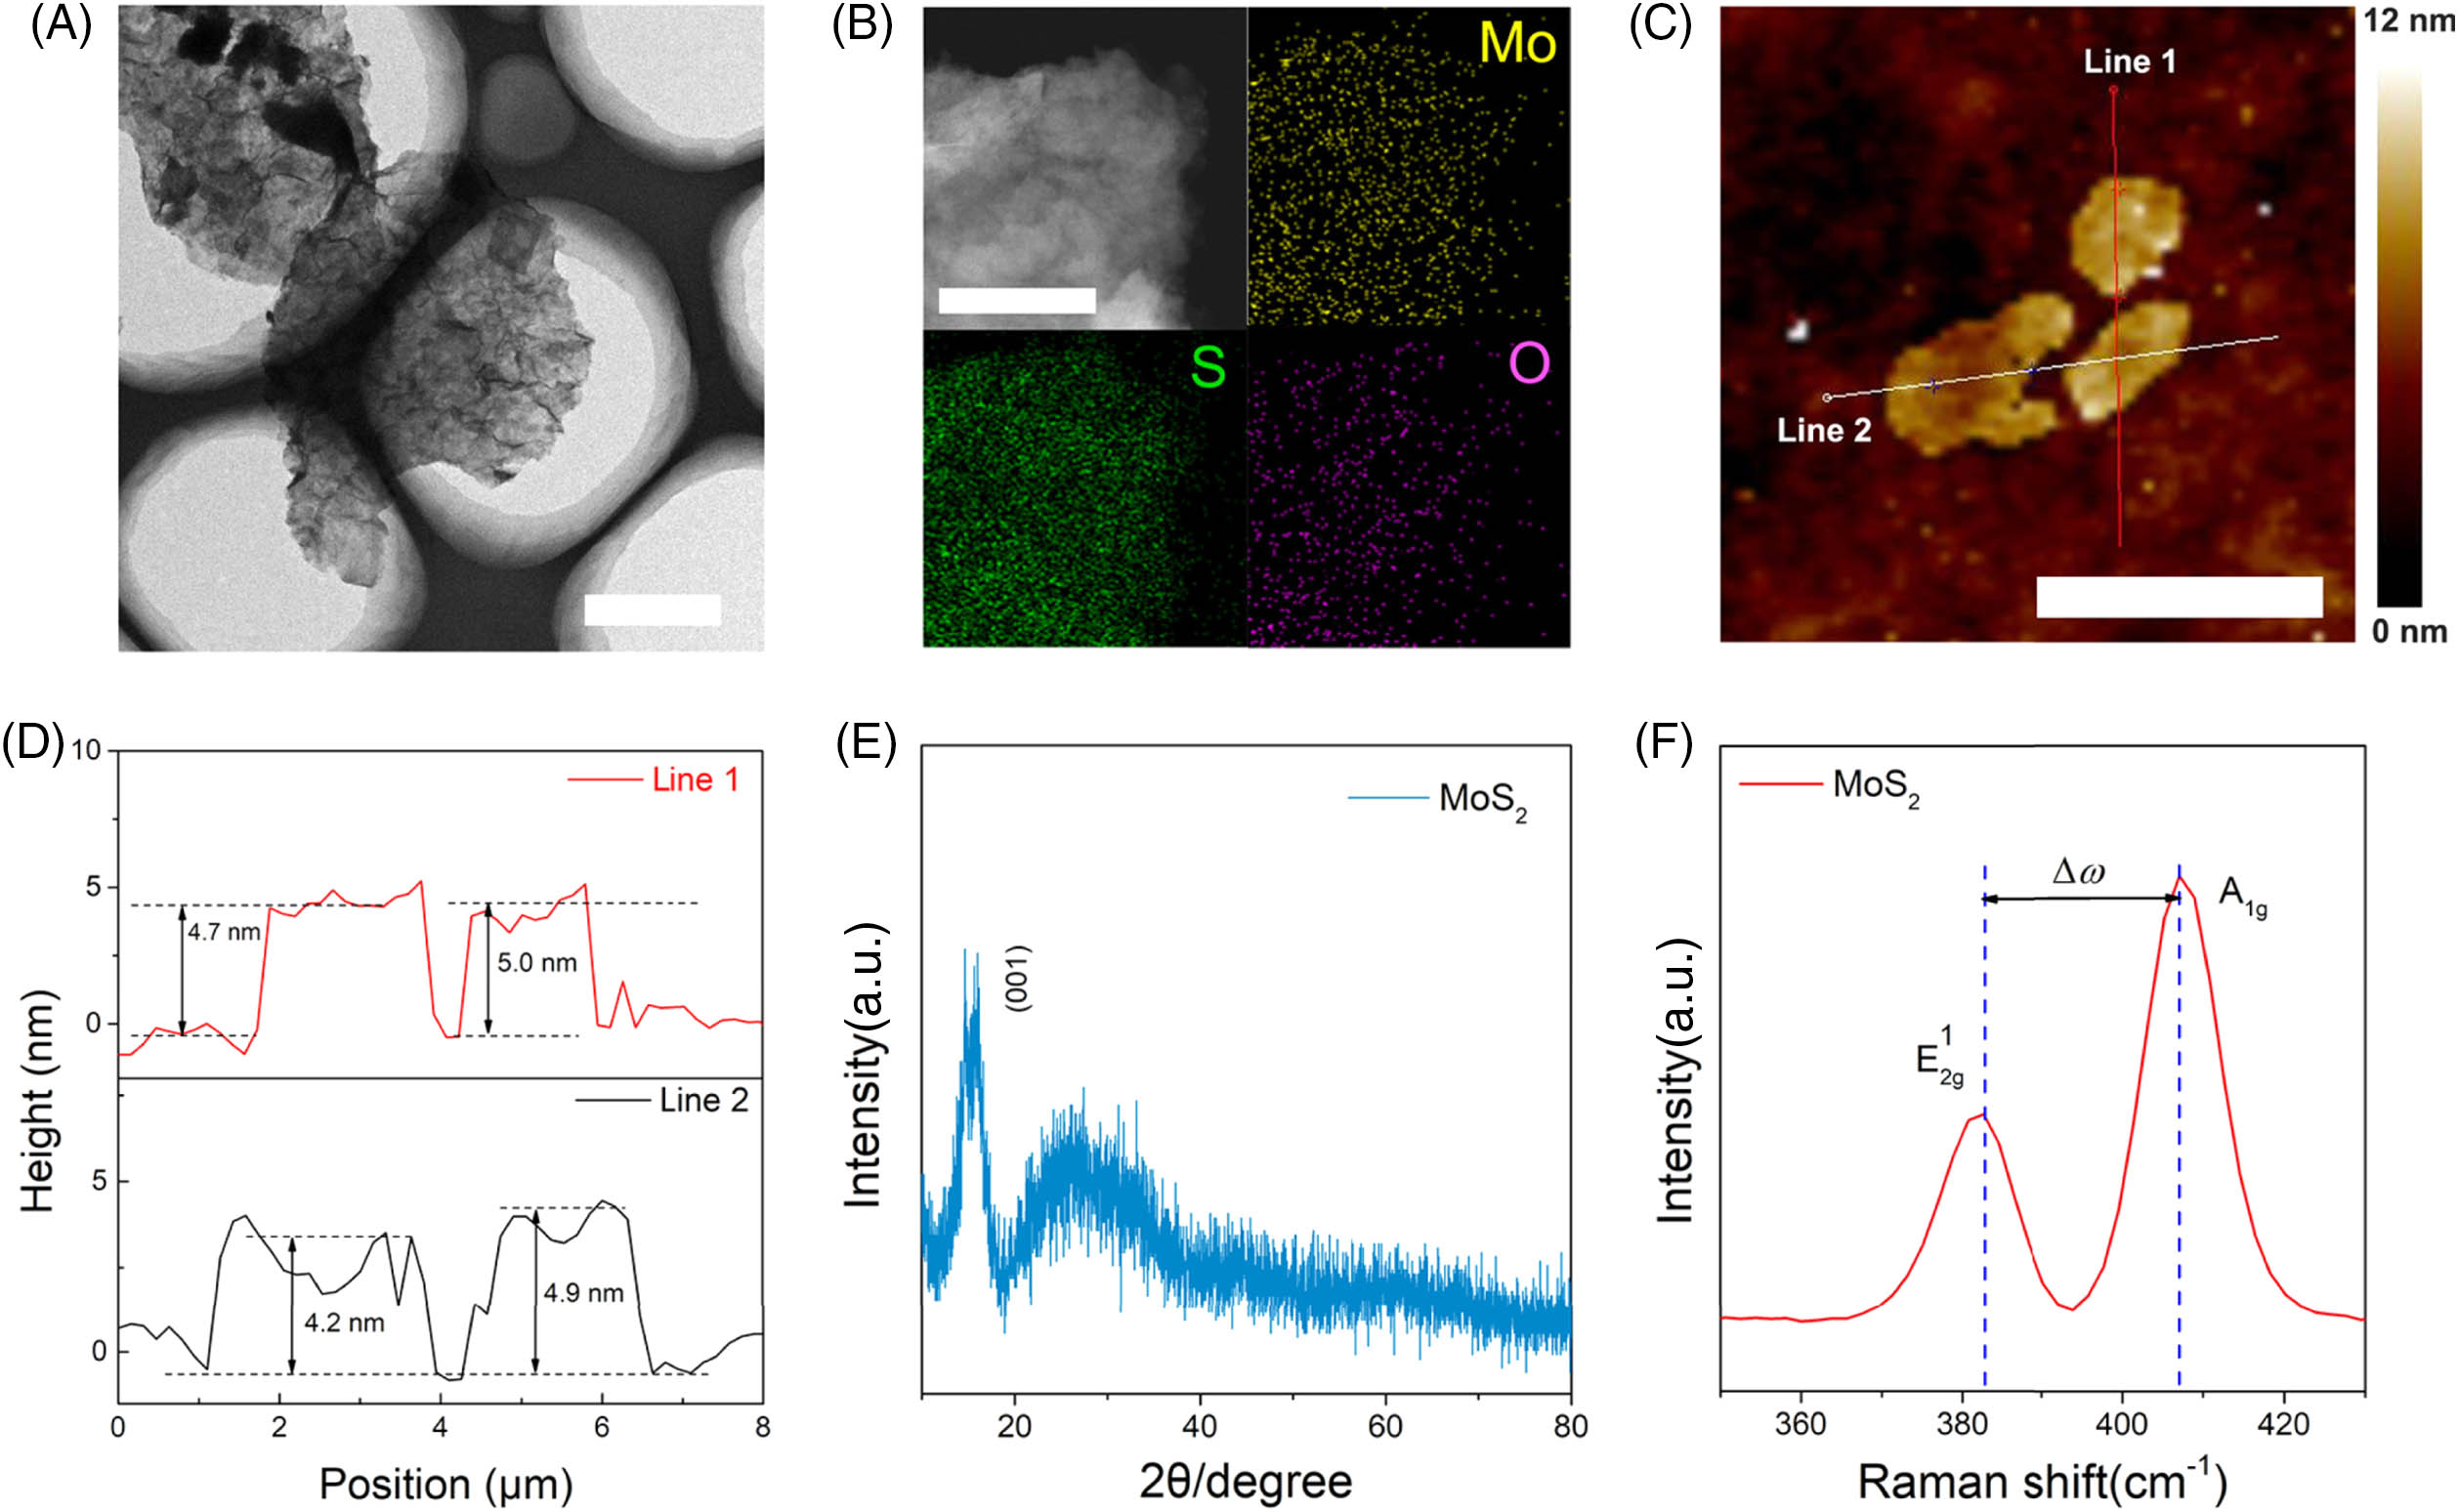
Si Xiao1, Ying Ma1, Yilin He1, Yiduo Wang1, Hao Xin1, Qi Fan1, Jingdi Zhang1, Xiaohong Li1, Yu Zhang1, Jun He1、2、*, and Yingwei Wang1、3、*
Author Affiliations
  • 1Hunan Key Laboratory for Super-microstructure and Ultrafast Process, School of Physics and Electronics, Central South University, Changsha 410083, China
  • 2e-mail: junhe@csu.edu.cn
  • 3e-mail: wyw1988@csu.edu.cn
  • show less
    DOI: 10.1364/PRJ.399364 Cite this Article Set citation alerts
    Si Xiao, Ying Ma, Yilin He, Yiduo Wang, Hao Xin, Qi Fan, Jingdi Zhang, Xiaohong Li, Yu Zhang, Jun He, Yingwei Wang. Revealing the intrinsic nonlinear optical response of a single MoS2 nanosheet in a suspension based on spatial self-phase modulation[J]. Photonics Research, 2020, 8(11): 1725 Copy Citation Text show less
    (A) TEM image of a MoS2 nanosheet (scale bar: 500 nm). (B) STEM image and EDX mapping images of MoS2 nanosheets (scale bar: 100 nm). (C) AFM image of present MoS2 nanosheets (scale bar: 5 μm). (D) The height profile corresponding to the solid line in (C). (E) and (F) XRD pattern and Raman spectrum of the MoS2 nanosheet.
    Fig. 1. (A) TEM image of a MoS2 nanosheet (scale bar: 500 nm). (B) STEM image and EDX mapping images of MoS2 nanosheets (scale bar: 100 nm). (C) AFM image of present MoS2 nanosheets (scale bar: 5 μm). (D) The height profile corresponding to the solid line in (C). (E) and (F) XRD pattern and Raman spectrum of the MoS2 nanosheet.
    (A) Schematic illustration of experimental facility for SSPM experiment measurement. (B) and (C), Photographs of 0.25%, 0.5%, and 0.75% (mass fraction) agarose gel samples (B) without MoS2 and (C) with MoS2. (B1)–(B3) and (C1)–(C3), SSPM patterns of samples (B1), (B2), (B3), and (C1), (C2), (C3) at 680 nm, under the same conditions. Samples (B1) and (C1) are fluids, (B2) and (C2) are quasi-solids, while (B3) and (C3) are solids. The clear enhancement observed in sample (C1) in a liquid suggests that wind-chime flakes contribute to SSPM.
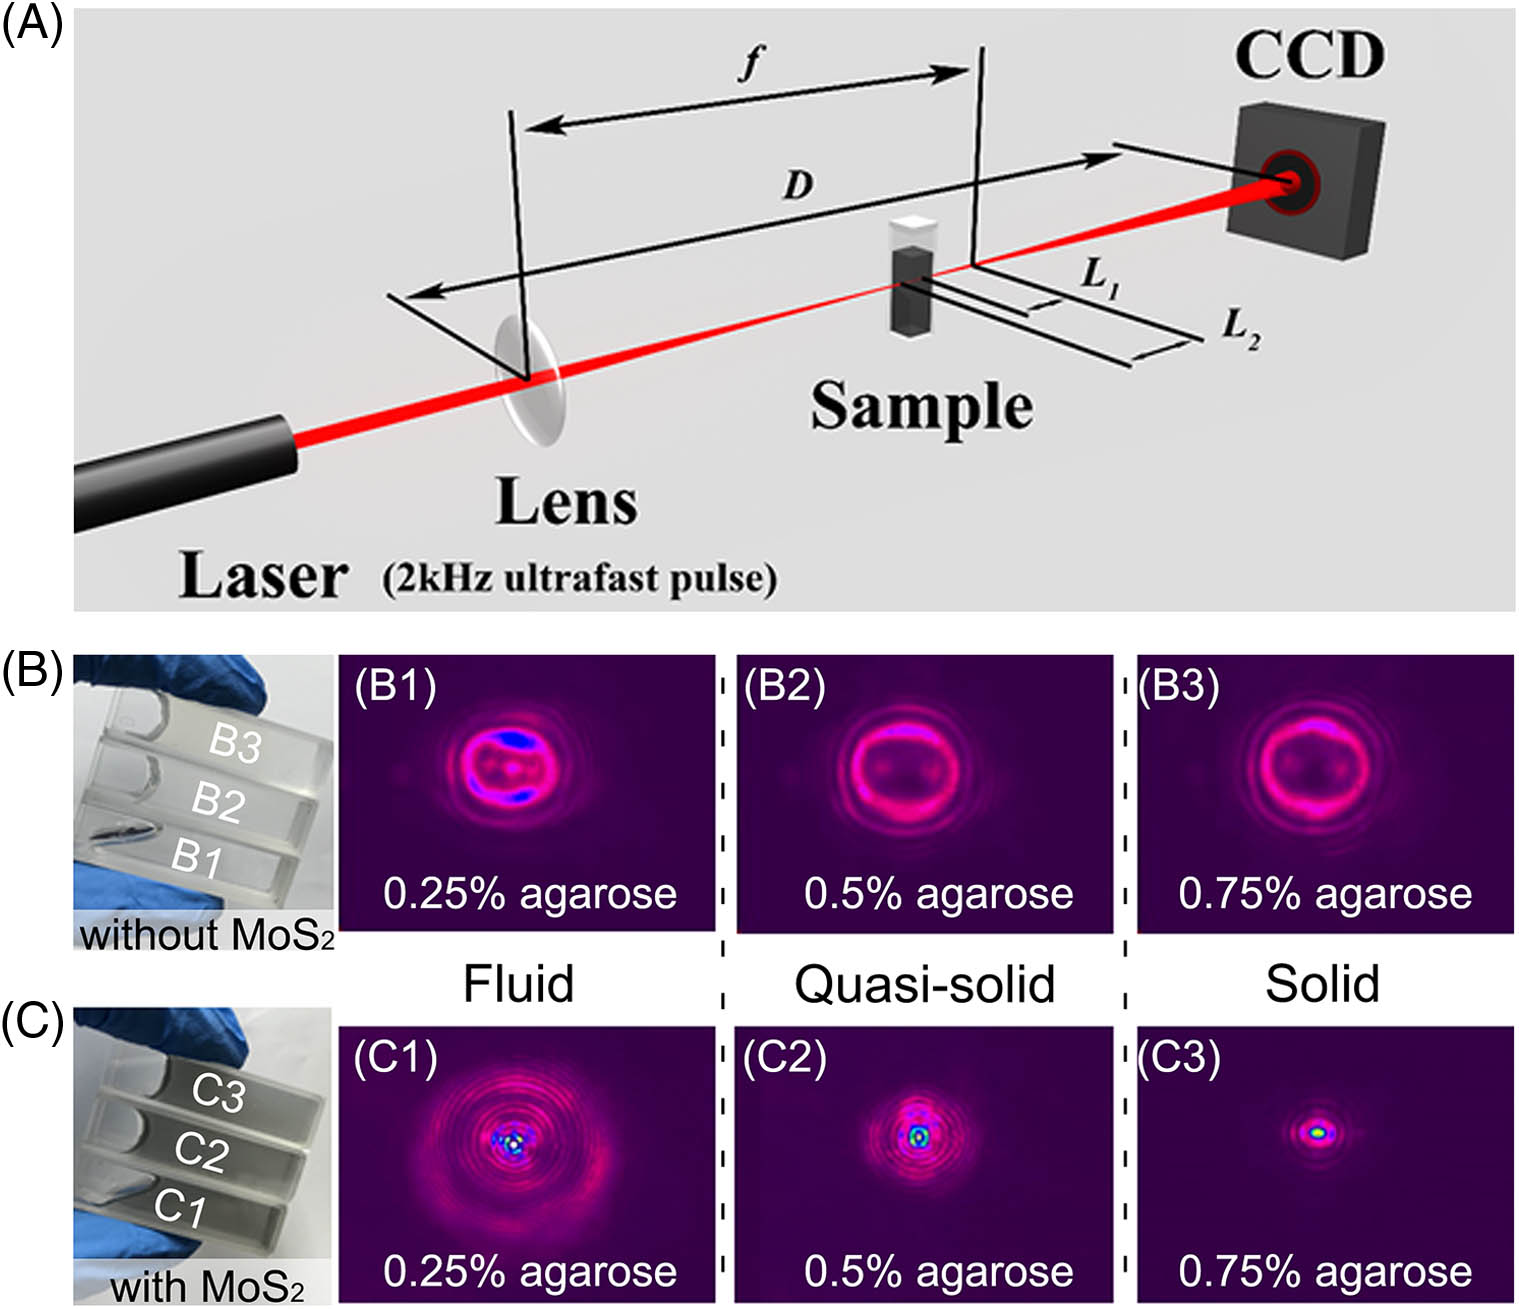
    Fig. 2. (A) Schematic illustration of experimental facility for SSPM experiment measurement. (B) and (C), Photographs of 0.25%, 0.5%, and 0.75% (mass fraction) agarose gel samples (B) without MoS2 and (C) with MoS2. (B1)–(B3) and (C1)–(C3), SSPM patterns of samples (B1), (B2), (B3), and (C1), (C2), (C3) at 680 nm, under the same conditions. Samples (B1) and (C1) are fluids, (B2) and (C2) are quasi-solids, while (B3) and (C3) are solids. The clear enhancement observed in sample (C1) in a liquid suggests that wind-chime flakes contribute to SSPM.
    Schematic of the general wind-chime model. (A) Schematic distribution diagram of MoS2 nanosheets with laser irradiation. Some random flakes convert into wind-chime flakes (red) because of the laser field, while the other portion of random flakes (gray) is still distributed randomly. The number of wind-chime flakes decreases because of the intensity attenuation in the transmission direction. The interaction length is L (∼10 mm), and the beam radius is ωR (∼300 μm). Atotal is the amount of nanosheets in the laser field. (B)–(E) represent the variation of wind-chime flakes with increasing laser intensity or concentration. The general wind-chime model can be applied to all of these conditions.
    Fig. 3. Schematic of the general wind-chime model. (A) Schematic distribution diagram of MoS2 nanosheets with laser irradiation. Some random flakes convert into wind-chime flakes (red) because of the laser field, while the other portion of random flakes (gray) is still distributed randomly. The number of wind-chime flakes decreases because of the intensity attenuation in the transmission direction. The interaction length is L (10  mm), and the beam radius is ωR (300  μm). Atotal is the amount of nanosheets in the laser field. (B)–(E) represent the variation of wind-chime flakes with increasing laser intensity or concentration. The general wind-chime model can be applied to all of these conditions.
    Dependence of ring numbers on laser intensity, concentration, and interaction length. (A) Transmittance of the MoS2 dispersions for different concentrations at 680 nm. The inset is a photograph of the samples. The extinction coefficient α is 437.3 mL·mg−1·m−1 according to the Lambert–Beer law. (B) Ring numbers vary with incident light intensity and concentration (the interaction length L is 10 mm). The experimental values and calculation results, using Eq. (4), are also shown. (C) Relationship between the number of rings and the interaction length for different laser intensities (concentration=0.1875 mg/mL). All dots represent measured values, while the curved surface and the lines are the calculated results using Eq. (4).
    Fig. 4. Dependence of ring numbers on laser intensity, concentration, and interaction length. (A) Transmittance of the MoS2 dispersions for different concentrations at 680 nm. The inset is a photograph of the samples. The extinction coefficient α is 437.3  mL·mg1·m1 according to the Lambert–Beer law. (B) Ring numbers vary with incident light intensity and concentration (the interaction length L is 10 mm). The experimental values and calculation results, using Eq. (4), are also shown. (C) Relationship between the number of rings and the interaction length for different laser intensities (concentration=0.1875  mg/mL). All dots represent measured values, while the curved surface and the lines are the calculated results using Eq. (4).
    Laser intensity attenuation curve along the optical path under different conditions: (A) Iout<Ith; (B) Ith<Iout<Isa; (C) Iout>Isa. Inset: the dashed line indicates two critical incident light intensities (Isa and Ith), where 100% or 0% active flakes are involved with SSPM in dispersions. (D) Contour plot of the experimental ring numbers at different concentrations and incident light intensities. The map was divided into three parts by two dashed lines, which were determined based on the threshold intensity Ith and the saturation intensity Isa. (E) Trend of the laser intensity attenuation curve along the optical path, which corresponds to the change of incident intensity I0 or concentration c, for the three typical cases located in different zones.
    Fig. 5. Laser intensity attenuation curve along the optical path under different conditions: (A) Iout<Ith; (B) Ith<Iout<Isa; (C) Iout>Isa. Inset: the dashed line indicates two critical incident light intensities (Isa and Ith), where 100% or 0% active flakes are involved with SSPM in dispersions. (D) Contour plot of the experimental ring numbers at different concentrations and incident light intensities. The map was divided into three parts by two dashed lines, which were determined based on the threshold intensity Ith and the saturation intensity Isa. (E) Trend of the laser intensity attenuation curve along the optical path, which corresponds to the change of incident intensity I0 or concentration c, for the three typical cases located in different zones.
    c (mg/mL)I0 (W/cm2)N|n2| (cm2/W)AtotalPtotalAeff|n2single| (cm2/W)
    0.187510.985.2×1057.32×10643.1%3.16×1065.24×1018Our work
    0.2510.186.9×1059.77×10630.9%3.02×1067.62×1018
    0.437520.3181.1×1041.71×10733.3%5.69×1063.47×1018
    0.1362.88×106Ref. [35]
    9.32×10⁷Ref. [24]
    1012Ref. [48]
    Table 1. Calculated Values for n2 of a Single MoS2 Nanosheet Involved in SSPM
    Si Xiao, Ying Ma, Yilin He, Yiduo Wang, Hao Xin, Qi Fan, Jingdi Zhang, Xiaohong Li, Yu Zhang, Jun He, Yingwei Wang. Revealing the intrinsic nonlinear optical response of a single MoS2 nanosheet in a suspension based on spatial self-phase modulation[J]. Photonics Research, 2020, 8(11): 1725
    Download Citation