1Hunan Key Laboratory for Super-microstructure and Ultrafast Process, School of Physics and Electronics, Central South University, Changsha 410083, China
Si Xiao, Ying Ma, Yilin He, Yiduo Wang, Hao Xin, Qi Fan, Jingdi Zhang, Xiaohong Li, Yu Zhang, Jun He, Yingwei Wang, "Revealing the intrinsic nonlinear optical response of a single MoS2 nanosheet in a suspension based on spatial self-phase modulation," Photonics Res. 8, 1725 (2020)
Copy Citation Text
The reorientation of 2D materials caused by nonlocal electron coherence is the formation mechanism of 2D material spatial self-phase modulation under laser irradiation, which is widely known as the “wind-chime” model. Here, we present a method that provides strong evidence for the reorientation of 2D-material-induced spatial self-phase modulation. The traditional “wind-chime” model was modified by taking into account the attenuation, i.e., damping of the incident light beam in the direction of the optical path. Accordingly, we can extract the nonlinear refractive index of a single nanosheet, instead of simply obtaining the index from an equivalent film that was constructed by all nanosheets. Our approach introduces a universal and accurate method to extract intrinsic nonlinear optical parameters from 2D material systems.
1. INTRODUCTION
Spatial self-phase modulation (SSPM), a relatively new and promising phase-modulation technique, has already been explored for conventional media with the aim to improve photonic devices, such as optical switch, liquid crystal [1–3]. Very recently, the boosting of graphene [4] related fantastic applications (field-effect transistors, energy storage, etc.) triggered the exploration of both graphene analog materials [5–7] and 2D materials for optical modulation [8]. Thanks to their unique physicochemical properties, unlike conventional dielectric media [9], they always show nontrivial amplitude and phase modulation capabilities for controlling light [10]. In addition, the superior nonlinear optical response of 2D materials has also attracted increased attention. Examples of investigated materials include graphene [11–13], transition metal dichalcogenides (TMDCs) [14–17], 2D topological insulators [18], black phosphorus [19,20], and other 2D materials [21,22]. In 2011, the SSPM of graphene dispersions was reported, in which, the relationship between the SSPM diffraction patterns and incident light intensity was used to extract the nonlinear refractive index of graphene [23]. Subsequently, SSPM-induced diffraction patterns were observed in several 2D material systems, including TMDCs, ultrathin topological insulators, and other 2D materials [24–30]. In our previous work, the dynamic formation process of SSPM patterns was investigated systematically, which improved the understanding of the formation mechanism responsible for the SSPM of 2D materials [31–33]. Moreover, the SSPM is a typical third-order nonlinear optical response process, similar to third-harmonic generation and four-wave mixing. Based on SSPM measurement, the nonlinear refractive index of 2D material can be extracted [23]. It shares the same advantage with the widely used nonlinear optical index extracted manner close-aperture Z-scan technique, such as the facile test condition, simple optical design, and convenient parameter extraction [34].
However, the underlying mechanism of SSPM in 2D material systems is still being debated. The wind-chime model is commonly used to explain the formation mechanism of SSPM diffraction patterns in suspensions. In this model, the nonlocal ac electron coherence among different flake domains of a 2D-material-induced reorientation of flakes is regarded as the underlying formation mechanism for SSPM [35]. By treating the 2D material as an equivalent film with respect to phase modulation, it is possible to extract nonlinear refractive indices [23]. However, there are also problems with this technique, which have been exposed recently [36]. Thanks to a better understanding of SSPM formation, we now know that the SSPM of 2D materials can reveal information about the concentration [37], laser intensity [38], and laser interaction effective-length dependence [37]. During the formation of the SSPM pattern, not all the flakes on the optical path contribute to the formation of the pattern. While knowing the number of active flakes helps extract the intrinsic nonlinear optical parameters of single 2D material nanosheets, this is still problematic.
In this work, we demonstrate that the SSPM of 2D layered materials originates from the third nonlinear optical Kerr effect of the 2D material. In addition, the wind-chime arrangement of also plays a critical role in the formation of SSPM patterns which was proved by an experimental observation. A general “wind-chime” model was proposed to determine the relationship among the number of SSPM rings, sample concentration, and optical path. In addition, the general wind-chime model can explain the saturation effect of SSPM patterns in which the number of SSPM rings remains unchanged upon increasing either the high laser intensity or sample concentration. Using the general wind-chime model, the proportion of active flakes in the optical path can be determined, which means we can extract the intrinsic nonlinear refractive index of a single nanoflake with high precision. This new approach represents a new universal technique, which can also be adapted to work directly with other nanomaterials systems.
Sign up for Photonics Research TOC. Get the latest issue of Photonics Research delivered right to you!Sign up now
2. SAMPLE FABRICATION
Reagents and setup: The bulk crystals were purchased from Nanjing MKNANO Tech. Co., Ltd. (Nanjing, China). Sodium hydroxide (NaOH), ethylene glycol (EG), and agarose gels were ordered from Macklin Inc. All chemical reagents were used without further purification.
Preparation of the nanosheets: nanosheets were synthesized using conventional liquid exfoliation of layered materials [39]. 100 mg bulk crystals were grinded to very small powder with an agate mortar and subsequently transferred into a 100 mL EG to obtain a 1 mg/mL solution. We sonicated the starting solution with an ultrasonic disruptor (BILON98-III, Bilon, China) for 6 h (amplifier: 25%, on/off cycle: 2 s/1 s). Then, the suspension was centrifuged at 3000 r/min to remove unexfoliated bulk . The supernatant was centrifuged at 9000 r/min to collect few-layer nanosheets. Finally, the obtained nanosheets were dried, using the freeze-drying method [39], for future use.
Characterization: Transmission electron microscopy (TEM), high-resolution TEM, scanning transmission electron microscopy (STEM), and energy-dispersive X-ray spectroscopy (EDX) were carried out on a JEM-3100, JEOL, Japan transmission electron microscope, 300 kV, spot 1 . The X-ray diffraction (XRD) patterns were obtained using a Bruker D8 ADVANCE XRD system. The Raman spectra were recorded using an inVia Qontor confocal Raman microscope (Renishaw, UK). The UV-vis-infrared spectra were recorded with a Carry 5000 spectrophotometer (Agilent Technologies, USA).
3. RESULTS AND DISCUSSION
A. Material Fabrication and Characterization
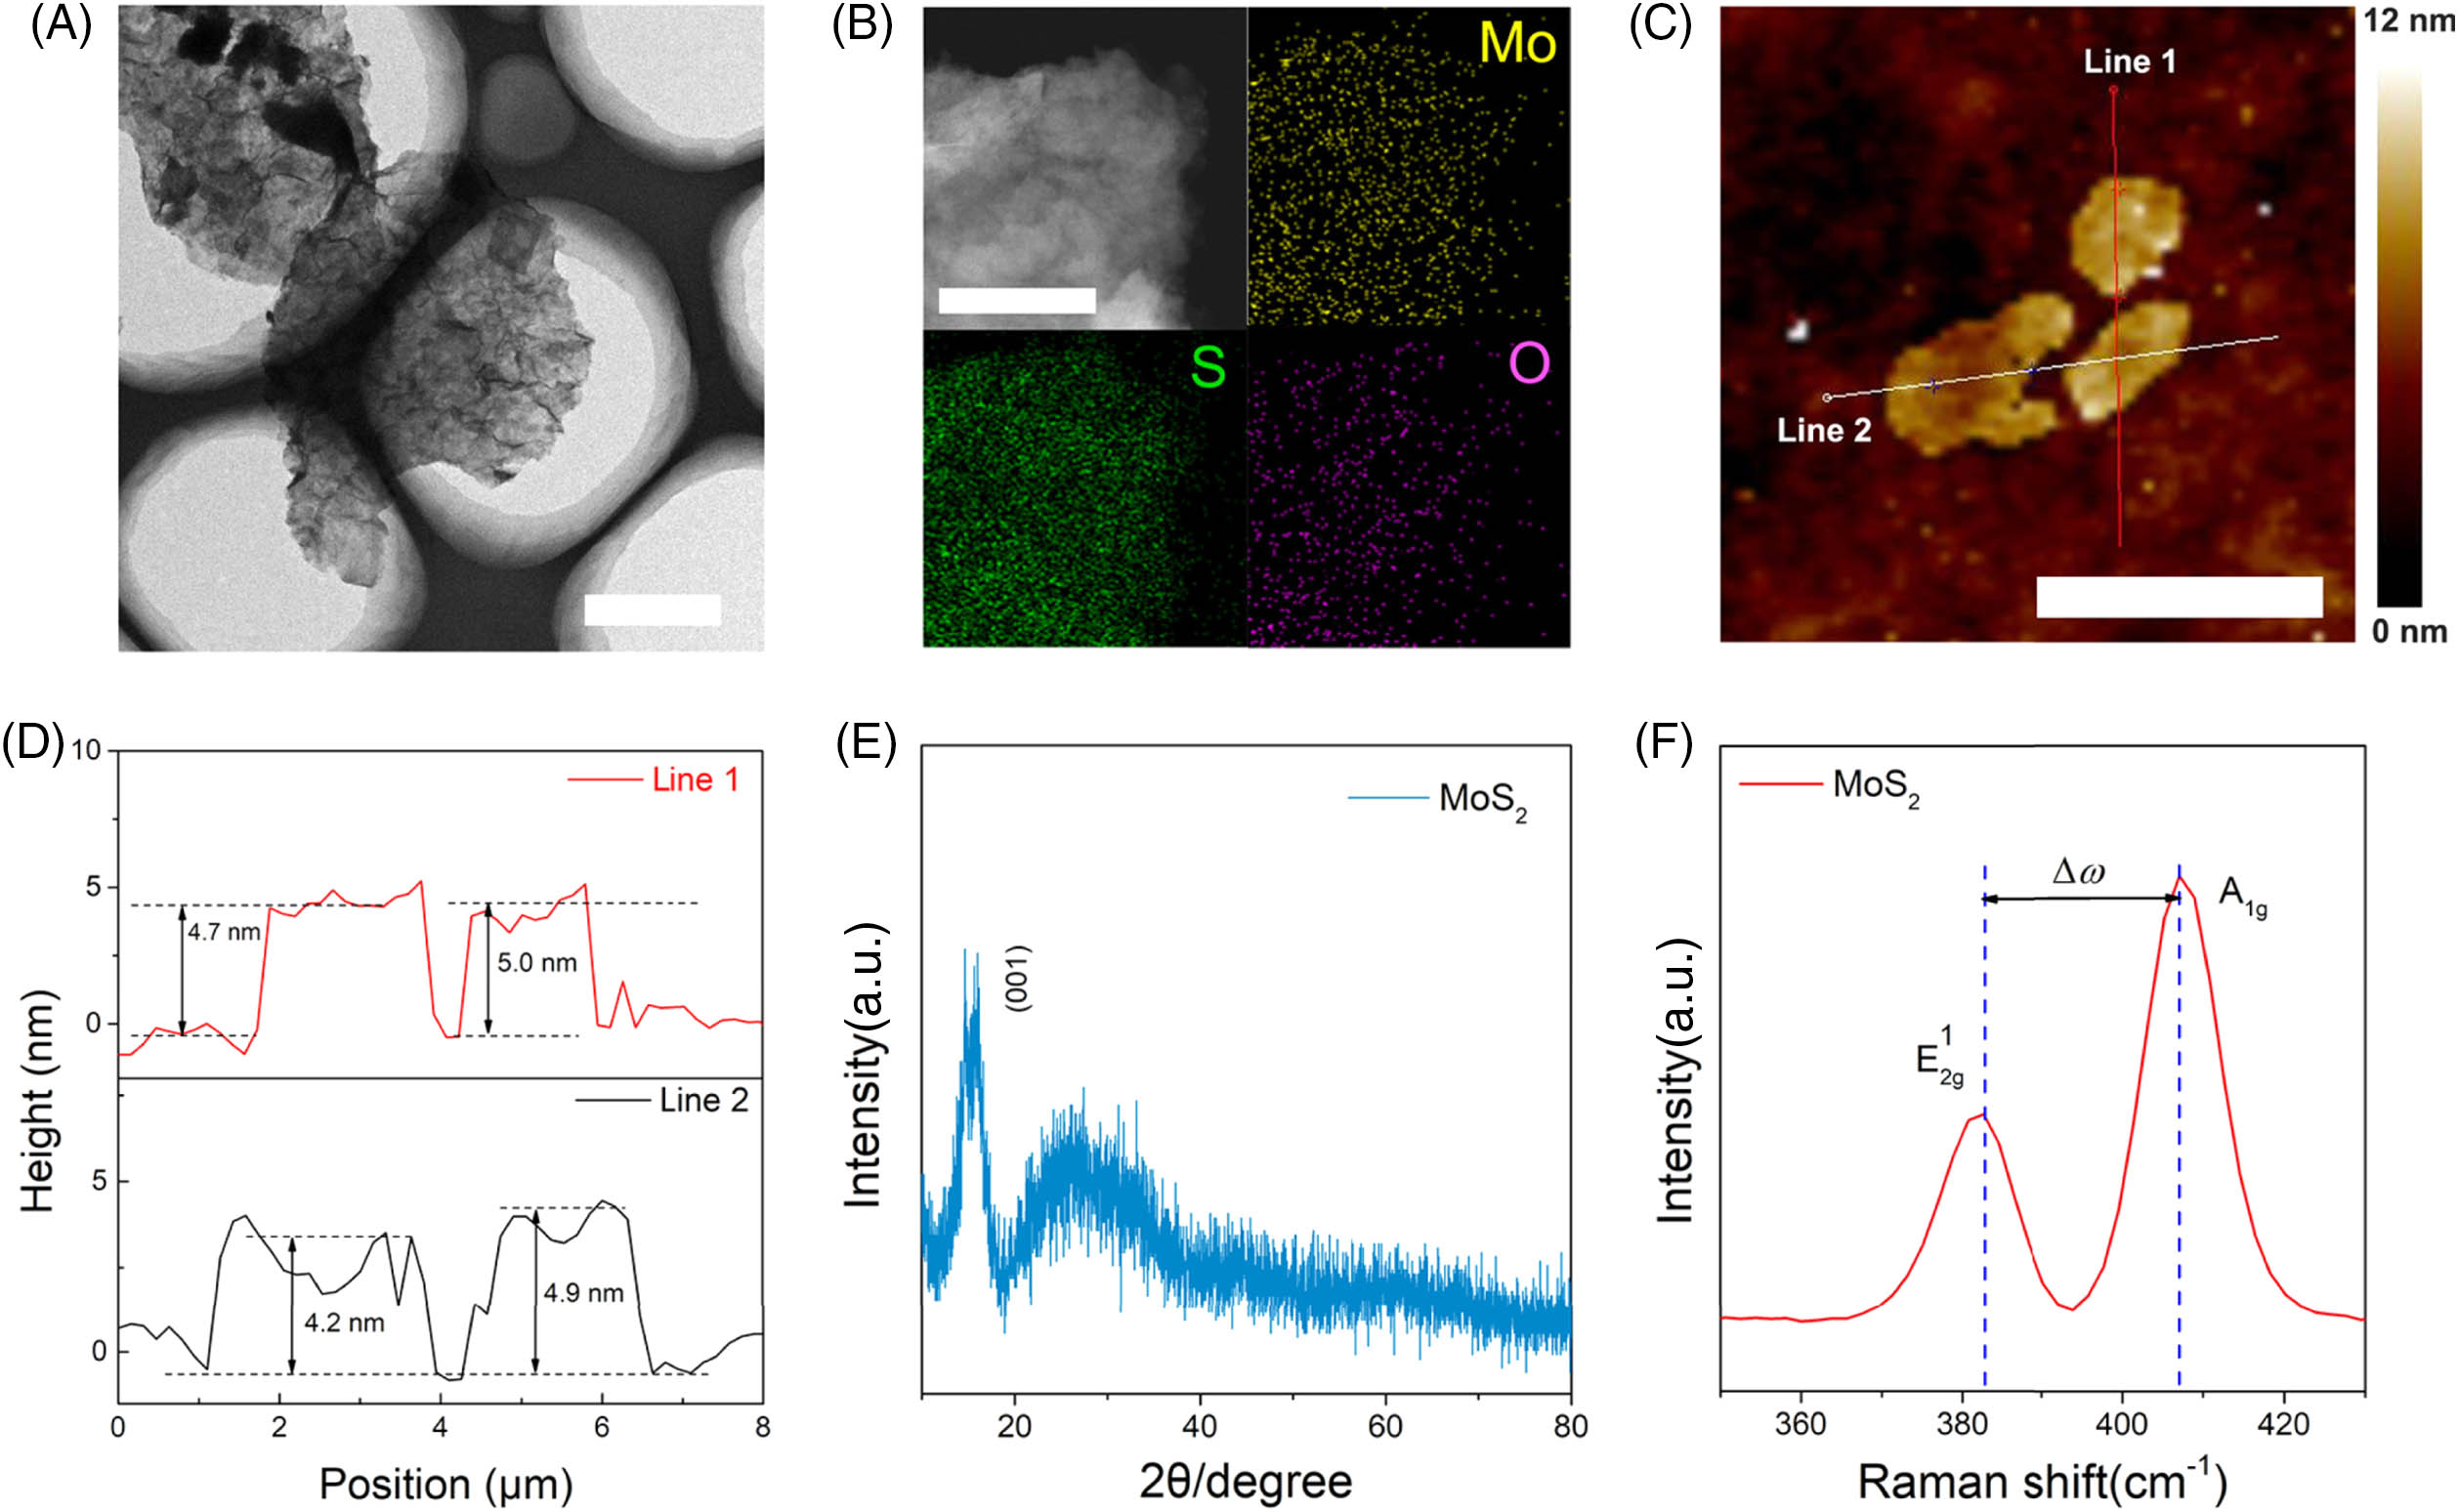
The nanosheets were synthesized via noted liquid exfoliation (see Section 2). The TEM image for revealed a sheet-like morphology, and the lateral size of these nanoflakes was approximately 2 μm [Fig. 1(A)]. To examine the elemental components of these nanosheets, both STEM and EDX mapping for were performed. As shown in Fig. 1(B), the distributions of Mo, S, and O are marked with colors (yellow, green, violet, and mixed). The high overlap of the distribution of the dominating elements Mo and S suggests that the sheet-like objects are, undoubtedly, nanosheets. Furthermore, the presence of O element suggests that the as-prepared nanosheets oxidation occurred during the preparation process. To know the thickness of the present nanosheets, the atomic force microscope (AFM) measurements were performed, as shown in Figs. 1(C) and 1(D). The thickness of the present nanosheets can be obtained from the height profile results in Fig. 1(D). The with such a thickness contained 7–8 monolayers (0.65 nm [40]). Considering 680 nm incident light, it is available to realize single-photon SSPM with Fermi distribution smearing and two-photon SSPM [34]. In Fig. 1(E), the XRD patterns show a typical peak at , which can be indexed to hexagonal structure for . This result agrees well with previous reports [41,42]. The Raman spectrum of nanosheets showed the typical peaks located at and , which correspond to and vibration modes. The mode is attributed to the out-of-plane vibrations of Mo and S. Moreover, can be assigned to the in-plane vibration mode which agrees well with previous reports [Fig. 1(F)] [43]. The frequency difference between two typical Raman modes is close to , which further confirmed several monolayers thickness of present nanosheets [43]. Those results provided evidence for the high quality and successful exfoliation of nanosheets.
Figure 1.(A) TEM image of a nanosheet (scale bar: 500 nm). (B) STEM image and EDX mapping images of nanosheets (scale bar: 100 nm). (C) AFM image of present nanosheets (scale bar: 5 μm). (D) The height profile corresponding to the solid line in (C). (E) and (F) XRD pattern and Raman spectrum of the nanosheet.
B. Experimental Validation of the Wind-Chime Model for 2D Material SSPM
A femtosecond (fs) pulsed laser (, 2 kHz), which has a smaller thermal effect and higher peak intensity than a continuous wave laser, was focused by a lens () [44,45]. The sample in a quartz cuvette was placed far away from the focus (). As a result, the interaction space between the sample and the laser was approximately cylindrical, and the corresponding interaction length was . The transmitted laser was received by the CCD (LBP2), where was the distance from the CCD to the lens, as shown in Fig. 2(A).
Figure 2.(A) Schematic illustration of experimental facility for SSPM experiment measurement. (B) and (C), Photographs of 0.25%, 0.5%, and 0.75% (mass fraction) agarose gel samples (B) without and (C) with . (B1)–(B3) and (C1)–(C3), SSPM patterns of samples (B1), (B2), (B3), and (C1), (C2), (C3) at 680 nm, under the same conditions. Samples (B1) and (C1) are fluids, (B2) and (C2) are quasi-solids, while (B3) and (C3) are solids. The clear enhancement observed in sample (C1) in a liquid suggests that wind-chime flakes contribute to SSPM.
Indeed, owing to the nonlocal electron coherent-induced SSPM being widely accepted, most of the reports of 2D-material SSPM were conducted in solution. The wind-chime model was proposed to explain this theory [34]. We introduced the concentration variable to modify the original model, and obtained the general wind-chime model. Here, different states of agarose solution (including liquid, quasi-solid, and solid) were used to affect the rotating behavior of nanosheets during the SSPM. After tilting the cuvette, the liquid level of the samples indicated that agarose in Figs. 2(B) (inset: B1) and 2(C) (inset: C1) was still in its liquid phase, while it was in the solid phase in Figs. 2(B) (inset: B3) and 2(C) (inset: C3). Figures 2(B) (inset: B2) and 2(C) (inset: C2) can be defined as the description of the quasi-solid state. As a result, we can obtain the strong evidence for the formation mechanism of SSPM. This is a major innovation in the present work. To investigate the formation mechanism of SSPM under this condition, we prepared six experimental groups. Figures 2(B) and 2(C) are photographs of 0.25% (fluid), 0.5% (quasi-solid), and 0.75% (solid) (mass fraction) agarose gel samples, with and without . The 0.25%, 0.5%, and 0.75% agarose gel samples in Fig. 2(B) were obtained by mixing 1% agarose with N,N-dimethylformamide (DMF) at the ratios ∶, ∶, and ∶ at 80°C. DMF is just a solvent for . We prepared three more samples, identical to Fig. 2(B), and then added the same amount of nanosheets to them to obtain 0.25 mg/mL agarose solution with different agarose contents; see Fig. 2(C). After cooling down for 10 min to room temperature, gel samples with different states were obtained. The SSPM results without are shown in Fig. 2(B) (inset: B1–B3), and the intensity of the incident laser was . As we can see, the patterns are hollow in the center, and limited thin rings appear at the periphery [46]. On the other hand, when the nanosheets were dispersed in the same solution as above, the typical SSPM patterns can be observed in all cases; see Fig. 2(C). Accordingly, the nonlinear optical properties of nanosheets are important for the formation of SSPM diffraction patterns. Interestingly, with increasing agarose content, the number of SSPM rings decreased significantly. A 0.25% agarose/DMF solution is a liquid, where a wind-chime nanosheet distribution forms in the liquid solution under laser irradiation. Upon increasing the agarose content in the solution, the solution changes from a liquid to a quasi-solid phase (0.5%), and even a solid phase (0.75%). In other words, in the solid (0.75%) agarose, the nanosheets are randomly distributed without any signs of reorientation. In the quasi-solid (0.5%) agarose, more nanosheets are involved in the wind-chime than in the solid phase, which causes more SSPM diffraction rings to be formed.
Thus, we have evidence that nonlocal electron-coherence-induced reorientation of nanosheets increases the phase modulation in SSPM of . These results provide new evidence that can help explain the wind-chime model for the SSPM pattern formation [34]. However, in the conventional wind-chime model, the assumption that all 2D nanosheets in the optical path are involved in the phase modulation was made, to calculate the nonlinear refractive index of monolayer graphene [23]. Using the above discussion and results [Figs. 2(B) and 2(C)], we know that only the active flakes in the optical path, which are parallel to the polarization direction of the laser, contribute to the formation of SSPM patterns. Therefore, it is necessary to discuss the effective number of 2D materials in SSPM, such that we can extract intrinsic nonlinear optical parameters of single nanosheets and even monolayer . Because the solidification of agarose may affect the accuracy of experimental results, in the next experiments about the nonlinear refractive index, all the samples were prepared in pure DMF without agarose.
C. General Wind-Chime Model for SSPM of 2D Materials
Figure 3(A) is a schematic diagram of the general wind-chime model. The total amount of nanosheets in the light field can be expressed as
Figure 3.Schematic of the general wind-chime model. (A) Schematic distribution diagram of nanosheets with laser irradiation. Some random flakes convert into wind-chime flakes (red) because of the laser field, while the other portion of random flakes (gray) is still distributed randomly. The number of wind-chime flakes decreases because of the intensity attenuation in the transmission direction. The interaction length is (), and the beam radius is (μ). is the amount of nanosheets in the laser field. (B)–(E) represent the variation of wind-chime flakes with increasing laser intensity or concentration. The general wind-chime model can be applied to all of these conditions.
Here, is the length of the laser action space, and is the radius. is of the order of millimeters, while is of the order of micrometers. The radius of the flake is , and the thickness is . In addition, is the concentration of the sample, and is the density.
Initially, all flakes were randomly distributed in the solution. When the light was incident on the samples, some of the nanosheets involved in the wind-chime model. According to the Beer–Lambert law [47], light absorption increases rapidly with mass concentration . The relationship between the incident light intensity, , and the intensity after extinction, , is governed by . This relation can be rewritten as
Here, is the attenuation length with a maximum (), and is the extinction coefficient. As the laser passes through the solution, the light intensity will attenuate as the optical path length increases. In the conventional wind-chime model it was not considered that the incident light intensity decreases while traveling along the optical path [23,34]. This is also a critical factor to modify the SSPM of a 2D material.
Both the refractive index of the medium and the laser intensity affect the phase shift when light propagates through the medium, and they determine the number of SSPM diffraction rings. In terms of the third-order nonlinearity, the refractive index can be represented as , where and are the linear and nonlinear refractive indices, respectively. is the intensity distribution. The phase shift of the laser after the interaction length can be described as [23] Here, is the irradiation direction, and is the wavelength.
The SSPM ring number , which reflects the phase shift, can be obtained using the relationship , where is 0. For a Gaussian laser beam, is twice the average intensity measured in the experiments. By combining Eqs. (2) and (3), the kernel formula for the general wind-chime model can be expressed as
The ring number is determined by the parameters , , , , , and . is the systematic error, which is affected by both the measurement accuracy and threshold laser intensity.
Equation (4) describes the dependence of the SSPM ring number on the laser intensity, concentration, and interaction length; see Figs. 3(B)–3(E). As shown in Fig. 3(B), all active nanosheets, which are marked red, contribute to the enhanced formation of SSPM patterns for . The random flakes (gray) do not contribute to the formation of SSPM diffraction rings directly but attenuate the laser light by absorbing or scattering the laser beam. As the laser intensity increases, more randomly oriented nanosheets are activated and parallel to the laser-induced electronic field until all nanosheets are involved; see Fig. 3(C). In this saturation state, the number of SSPM rings remains unchanged even though the laser intensity continues to increase. If the concentration of the solution increases, a portion of the added flakes are activated, while the rest are still randomly distributed; see Fig. 3(D). The laser intensity increases again [Fig. 3(E)], which results in a similar case as in Fig. 3(C), where the fraction of active nanosheets was approximately 100%.
To confirm the feasibility of the general wind-chime model, we investigated the dependence of SSPM ring numbers on the incident light intensity, concentration, and interaction length. Figure 4(A) shows the transmittance of the samples at 680 nm. The extinction coefficient is at 680 nm, which was obtained via fitting with Eq. (2), while the inset is a photograph of the samples. To note, the extinction coefficient at any wavelength can be obtained based on Beer–Lambert law. The extinction coefficient of 680 nm was taken as the representative one and kept consistent with the wavelength for SSPM measurement. Several samples with different concentrations (0.0625, 0.1825, 0.25, 0.4375, 0.625, 0.8125, and 1 mg/mL) were selected for the SSPM measurement. The blue dots in Fig. 4(B) represent the experimental data. The red surface was calculated using Eq. (4), where is 10 mm. The calculated values match the experimental data well. Figure 4(C) shows the experimental SSMP results (spherical scatter plot) of the sample (0.1875 mg/mL) with different laser intensities and interaction lengths. The different lengths were realized by changing the cuvette size (1, 2, 3, 5, 10, and 20 mm). According to the conventional wind-chime model, the number of SSPM rings shows a linear relationship that can be expressed as [23]. As shown in Fig. 4(C), as the cuvette length () increases, the typical nonlinear increase of the SSPM ring number is observed. The nonlinear relationship between interaction length and SSPM ring number indicates that the number of active flakes decreases with laser propagation because of laser attenuation. Using Eq. (4), we found that the calculated results agree well with the experimental data. The value for was calculated as for 0.1875 mg/mL, and was about 2.
Figure 4.Dependence of ring numbers on laser intensity, concentration, and interaction length. (A) Transmittance of the dispersions for different concentrations at 680 nm. The inset is a photograph of the samples. The extinction coefficient is according to the Lambert–Beer law. (B) Ring numbers vary with incident light intensity and concentration (the interaction length is 10 mm). The experimental values and calculation results, using Eq. (4), are also shown. (C) Relationship between the number of rings and the interaction length for different laser intensities (). All dots represent measured values, while the curved surface and the lines are the calculated results using Eq. (4).
D. Nonlinear Refractive Index of a Single Nanosheet
To obtain the intrinsic nonlinear optical response of single nanosheets, we need to know the number of active nanosheets, , in the optical path or within the interaction length. The can be expressed as
Here, is the amount of nanosheets in the optical path or interaction length. is the proportion of active nanosheets in the optical path. For a certain concentration, correlates with the incident light intensity and interaction length . Before discussing the extraction of , we need to define several key concepts to better understand the general wind-chime model. The threshold intensity is defined as the critical incident light intensity where some flakes start to rotate under such a laser intensity. If the incident intensity is below , is 0. Similarly, the saturation intensity is another critical incident light intensity when all the nanosheets involve in the wind-chime distribution, and the corresponding is 100%.
When the light passes through the solution, the intensity decreases and approaches the output intensity along the optical path. The light intensity , at different positions along the optical path, can be expressed with Eq. (2): . For the different output intensities, there are three typical cases between the attenuation curves of the incident light and the above-mentioned two critical intensities and ; see Figs. 5(A)–5(C). For the first case [Fig. 5(A)], where , the light intensity decreases to such a low value that the nanosheets cannot be rotated before the light leaves the cuvette. In Fig. 5(B), when decreases to a value between and , only the part of the nanosheet, which is located in the cross section of the optical path, is activated and considered in the wind-chime model. The proportion of active flakes, , can be expressed as
Figure 5.Laser intensity attenuation curve along the optical path under different conditions: (A) ; (B) ; (C) . Inset: the dashed line indicates two critical incident light intensities ( and ), where 100% or 0% active flakes are involved with SSPM in dispersions. (D) Contour plot of the experimental ring numbers at different concentrations and incident light intensities. The map was divided into three parts by two dashed lines, which were determined based on the threshold intensity and the saturation intensity . (E) Trend of the laser intensity attenuation curve along the optical path, which corresponds to the change of incident intensity or concentration , for the three typical cases located in different zones.
When [Fig. 5(C)], reorientation of all nanosheets in the optical path occurs, where is very close to 100%.
In Fig. 5(D), the contour map of the SSPM ring number for different experimental conditions can be obtained using the results shown in Fig. 3(B). According to Eq. (2), two critical concentration curves, ① and ②, which correspond to and , can be obtained using the formula shown in the inset of Fig. 5(D). The map in Fig. 5(D) can be divided into three zones using curves ① and ②. Within the Part I zone, the ring number was mainly determined by the incident intensity, which is the intensity-sensitive zone. Within the Part III zone, the ring number was mainly affected by the concentration of the , which is therefore also referred to as the concentration-sensitive zone. Part II represents the intermediate zone between the above two zones, and is sensitive to both incident intensity and concentration. For the A0 case, for example, which is located in Part I, the spatial distribution of the wind-chime flakes is shown in the top panel of Fig. 5(E). There, represents the effective area, while is below the threshold intensity, identical to the condition in Fig. 5(B). If the concentration of increases in Fig. 5(E) (inset: A1), the number of SSPM rings decreases slightly. The reason for this is that, when the concentration increases, the total amount increases. The number of active flakes, however, remained unchanged due to the constant energy of the incident laser. With increasing incident intensity [Fig. 5(E) (inset: A2)], the number of SSPM rings increased significantly. This is revealed by the increased effective area of . The changing trends for the SSPM ring number and the conditions B0 and C0 were present in the center and bottom panels in Fig. 5(E). Using the information in Fig. 5(E), we can improve our understanding of the important factors that affect SSPM.
Furthermore, using Eq. (4), the effective for the dispersions can be obtained. In Table 1, we calculated for the nanosheets of the same size for different concentrations or incident light intensities (μ, μ, , and ). The change of the SSPM ring number is relatively consistent with that of , which is affected by both the concentration and incident light intensity. The of , at a concentration of 0.1875 mg/mL, is determined as , which is comparable with (0.136 mg/mL ) from previous reports [34,35]. Note that this result shows the refractive index of equivalent thin film rather than the intrinsic index of a single nanosheet. According to the general wind-chime model, only a fraction, , of nanosheets are active. Their number can be calculated via . Therefore, the intrinsic refractive index [23]. Furthermore, of a single nanosheet at 680 nm was found to be .
c (mg/mL)
I0 (W/cm2)
N
|n2| (cm2/W)
Atotal
Ptotal
Aeff
|n2single| (cm2/W)
0.1875
10.9
8
5.2×10⁻⁵
7.32×10⁶
43.1%
3.16×10⁶
5.24×10⁻¹⁸
Our work
0.25
10.1
8
6.9×10⁻⁵
9.77×10⁶
30.9%
3.02×10⁶
7.62×10⁻¹⁸
0.4375
20.3
18
1.1×10⁻⁴
1.71×10⁷
33.3%
5.69×10⁶
3.47×10⁻¹⁸
0.136
–
–
2.88×10⁻⁶
–
–
–
–
Ref. [35]
–
–
–
9.32×10⁻⁷
–
–
–
–
Ref. [24]
–
–
–
–
–
–
–
∼10−12
Ref. [48]
Table 1. Calculated Values for of a Single Nanosheet Involved in SSPM
In conclusion, we experimentally confirmed that reorientation of nanosheets, which was caused by nonlocal electron coherence, was likely responsible for the formation of SSPM patterns, especially when the low repetition rate fs laser was chosen and the thermal effect was small. A general “wind-chime” model was proposed, after modifying the conventional model, to investigate the SSPM patterns under different conditions (e.g., concentration and light intensity saturation). Furthermore, the number of active flakes was obtained, which offers the possibility to extract the intrinsic nonlinear optical response of a single nanosheet. Using the new model, a significantly more accurate and intrinsic nonlinear refractive index for was found. The determined nonlinear refractive index of was , which is several orders of magnitude more accurate than for the equivalent film. The results of this study add new ways to obtain nonlinear optical refractive parameters of 2D materials, which are facile and feasible.
Si Xiao, Ying Ma, Yilin He, Yiduo Wang, Hao Xin, Qi Fan, Jingdi Zhang, Xiaohong Li, Yu Zhang, Jun He, Yingwei Wang, "Revealing the intrinsic nonlinear optical response of a single MoS2 nanosheet in a suspension based on spatial self-phase modulation," Photonics Res. 8, 1725 (2020)