• Journal of Inorganic Materials
  • Vol. 34, Issue 4, 387 (2019)
Ren-De CHEN1, Peng GUO1, Xiao ZUO1, Shi-Peng XU2, Pei-Ling KE1、3, and Ai-Ying WANG1、3、*
Author Affiliations
  • 1Zhejiang Key Laboratory of Marine Materials of Protective Technologies, Key Laboratory of Marine Materials and Related Technologies, Ningbo Institute of Materials Technology and Engineering, Chinese Academy of Sciences, Ningbo 315201, China
  • 2Gansu Key Laboratory of Solar Power Generation System Project, Jiuquan Vocational and Technical College, Jiuquan 735000, China
  • 3Center of Materials Science and Optoelectronics Engineering, University of Chinese Academy of Sciences, Beijing 100049, China
  • show less
    DOI: 10.15541/jim20180263 Cite this Article
    Ren-De CHEN, Peng GUO, Xiao ZUO, Shi-Peng XU, Pei-Ling KE, Ai-Ying WANG. Ag Doped Amorphous Carbon Films: Structure, Mechanical and Electrical Behaviors[J]. Journal of Inorganic Materials, 2019, 34(4): 387 Copy Citation Text show less
    Typical XPS spectra for the a-C:Ag films (a), and representative Ag 3d spectra of the films with 41.4at% Ag (b)
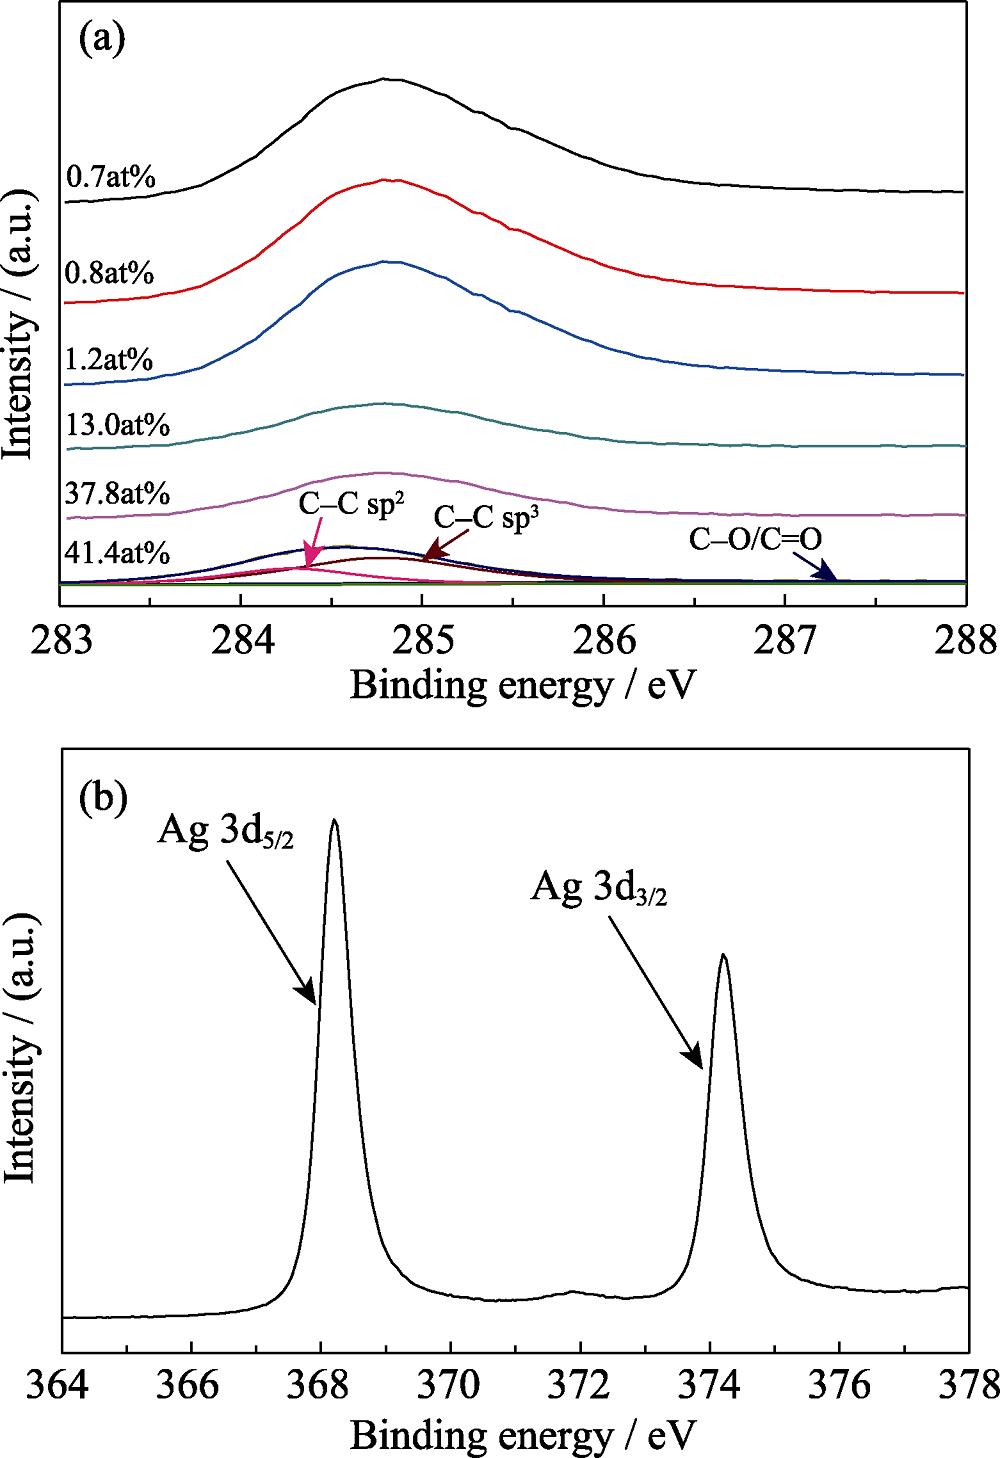
    1. Typical XPS spectra for the a-C:Ag films (a), and representative Ag 3d spectra of the films with 41.4at% Ag (b)
    XRD patterns of a-C:Ag films with various Ag concentrations
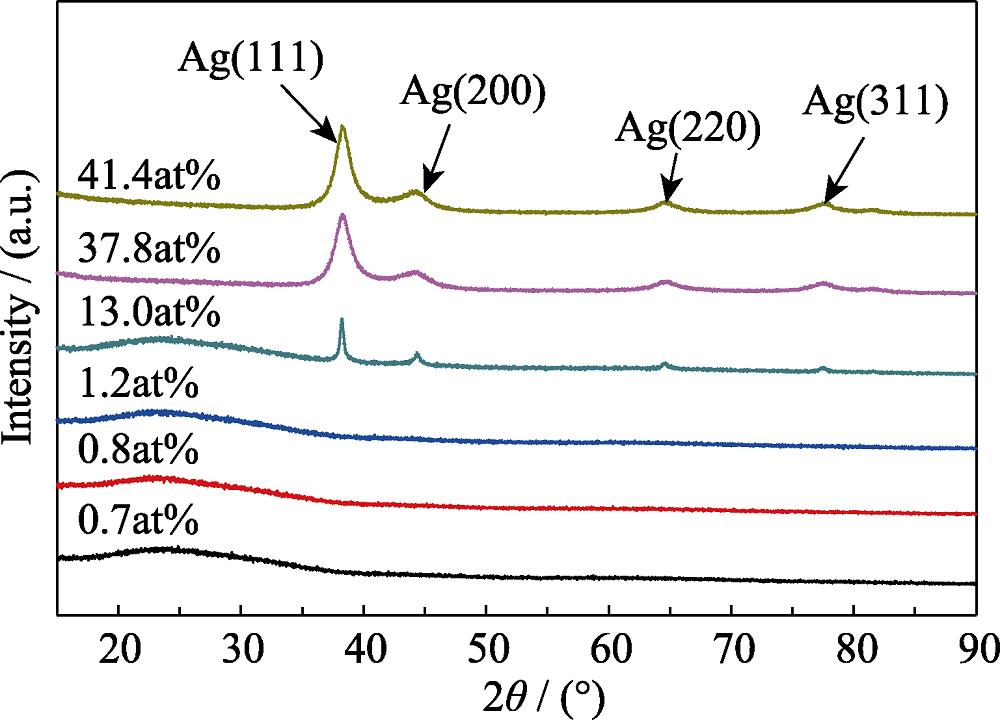
    2. XRD patterns of a-C:Ag films with various Ag concentrations
    (a) Sample for TEM prepared by FIB, (b) HRTEM and SAED of sample with 1.2at% a-C:Ag
    3. (a) Sample for TEM prepared by FIB, (b) HRTEM and SAED of sample with 1.2at% a-C:Ag
    Typical Raman spectra a-C:Ag films with different Ag concentrations (a) and the fitting result of a-C:Ag film with 0.7at% Ag atoms (b)
    4. Typical Raman spectra a-C:Ag films with different Ag concentrations (a) and the fitting result of a-C:Ag film with 0.7at% Ag atoms (b)
    Surface topographies of a-C:Ag films with different Ag concentrations
    5. Surface topographies of a-C:Ag films with different Ag concentrations
    Hardness (a) and elastic modulus (b) as a function of Ag concentration
    6. Hardness (a) and elastic modulus (b) as a function of Ag concentration
    Residual compressive stress of a-C:Ag films as a function of Ag concentration
    7. Residual compressive stress of a-C:Ag films as a function of Ag concentration
    Temperature dependence of resistivity in a-C:Ag film with 37.8at% Ag in the range of 8~400 K (a) and the a-C:Ag with 41.4at% Ag in the range of 2~400 K (b)
    8. Temperature dependence of resistivity in a-C:Ag film with 37.8at% Ag in the range of 8~400 K (a) and the a-C:Ag with 41.4at% Ag in the range of 2~400 K (b)
    Plot of lnρ vs reciprocal temperature in the range of 164-400 K for a-C:Ag film with 41.4at% Ag
    9. Plot of lnρ vs reciprocal temperature in the range of 164-400 K for a-C:Ag film with 41.4at% Ag
    Sputtering current/ASputtering power/WAg concentration/at%O concentration/at%Thickness/nmDeposition rate/(nm•min-1)
    1.35820.730.2364.518.2
    1.46020.826.5358.317.9
    1.56471.227.2508.525.4
    1.685913.045.2725.436.3
    1.878837.832.91409.170.5
    2.085641.432.21720.486.0
    Table 1. Ag concentration, O concentration, film thickness and average deposition rate varied with sputtering current and power
    Ag concentration/at%G-peakposition/cm-1ID/IGFWHM of G-peak/cm-1
    0.71533.00.75159.4
    0.81535.90.79151.6
    1.21539.80.85151.4
    13.01582.51.94122.5
    37.81566.42.15123.6
    41.41580.72.68110.0
    Table 2. The fitted G-peak position, ID/IG and FWHM of G-peak varied with different Ag concentrations
    Ren-De CHEN, Peng GUO, Xiao ZUO, Shi-Peng XU, Pei-Ling KE, Ai-Ying WANG. Ag Doped Amorphous Carbon Films: Structure, Mechanical and Electrical Behaviors[J]. Journal of Inorganic Materials, 2019, 34(4): 387
    Download Citation