• Photonics Research
  • Vol. 8, Issue 12, 1818 (2020)
Jiaji Li1、2, Alex Matlock3, Yunzhe Li3, Qian Chen1, Lei Tian3、4, and Chao Zuo1、2、*
Author Affiliations
  • 1School of Electronic and Optical Engineering, Nanjing University of Science and Technology, Nanjing 210094, China
  • 2Smart Computational Imaging Laboratory (SCILab), Nanjing University of Science and Technology, Nanjing 210094, China
  • 3Department of Electrical and Computer Engineering, Boston University, Boston, Massachusetts 02215, USA
  • 4e-mail: leitian@bu.edu
  • show less
    DOI: 10.1364/PRJ.403873 Cite this Article Set citation alerts
    Jiaji Li, Alex Matlock, Yunzhe Li, Qian Chen, Lei Tian, Chao Zuo. Resolution-enhanced intensity diffraction tomography in high numerical aperture label-free microscopy[J]. Photonics Research, 2020, 8(12): 1818 Copy Citation Text show less
    System illustration of reIDT technique. (a) Photograph of reIDT setup. The setup consists of a standard microscope equipped with a high-density LED array and a high numerical aperture condenser. (b) LED array illumination unit is placed in the front focal plane of the condenser lens. The radius R of the annular pattern is tuned such that the illumination angle is approximately matched with the objective NA. (c) Each IDT image measures the interference between the scattered and the unperturbed fields. (d) The absorption and phase transfer functions at various illumination angles and sample depths. (e) Intensity images are taken by varying the illumination angle. Captured Fourier spectrum of the raw data exhibits two shifted circles, whose shift is set by the LED illumination angle on the annular pattern. (f) Frequency support region of 3D TFs in k-space. 2D cross-section plot of 3D TFs to illustrate the missing cone issue and cutoff frequency along lateral and axial directions.
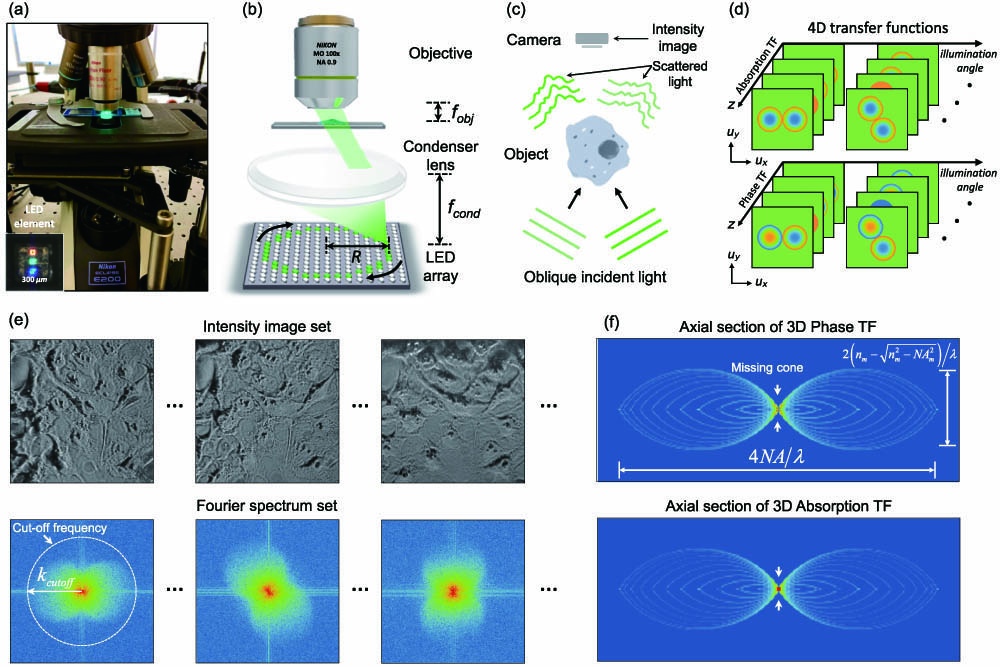
    Fig. 1. System illustration of reIDT technique. (a) Photograph of reIDT setup. The setup consists of a standard microscope equipped with a high-density LED array and a high numerical aperture condenser. (b) LED array illumination unit is placed in the front focal plane of the condenser lens. The radius R of the annular pattern is tuned such that the illumination angle is approximately matched with the objective NA. (c) Each IDT image measures the interference between the scattered and the unperturbed fields. (d) The absorption and phase transfer functions at various illumination angles and sample depths. (e) Intensity images are taken by varying the illumination angle. Captured Fourier spectrum of the raw data exhibits two shifted circles, whose shift is set by the LED illumination angle on the annular pattern. (f) Frequency support region of 3D TFs in k-space. 2D cross-section plot of 3D TFs to illustrate the missing cone issue and cutoff frequency along lateral and axial directions.
    Demonstration of the proposed self-calibration method on an LED matrix with annular illumination pattern. (a), (b) The LED positions from manual alignment (termed uncalibrated, marked in blue star), initial guess of calibration (termed Init-calibrated, marked in red dot), and calibrated spatial frequency positions of LEDs (green triangle), plotted in the spatial frequency coordinates. (c), (d) 1D abscissa and the ordinate spatial illumination frequency plots of each LED on the annular pattern. Uncalibrated spatial frequency positions u, v (marked in blue line); Init-calibrated spatial frequency positions u, v (marked in red line); and calibrated spatial frequency positions u, v (marked in green line). (e) Calibrated numerical aperture of each LED element. (f)–(i) Captured Fourier spectrum using the corresponding LED (marked with arrows) along with calibrated pupil positions (marked by circles).
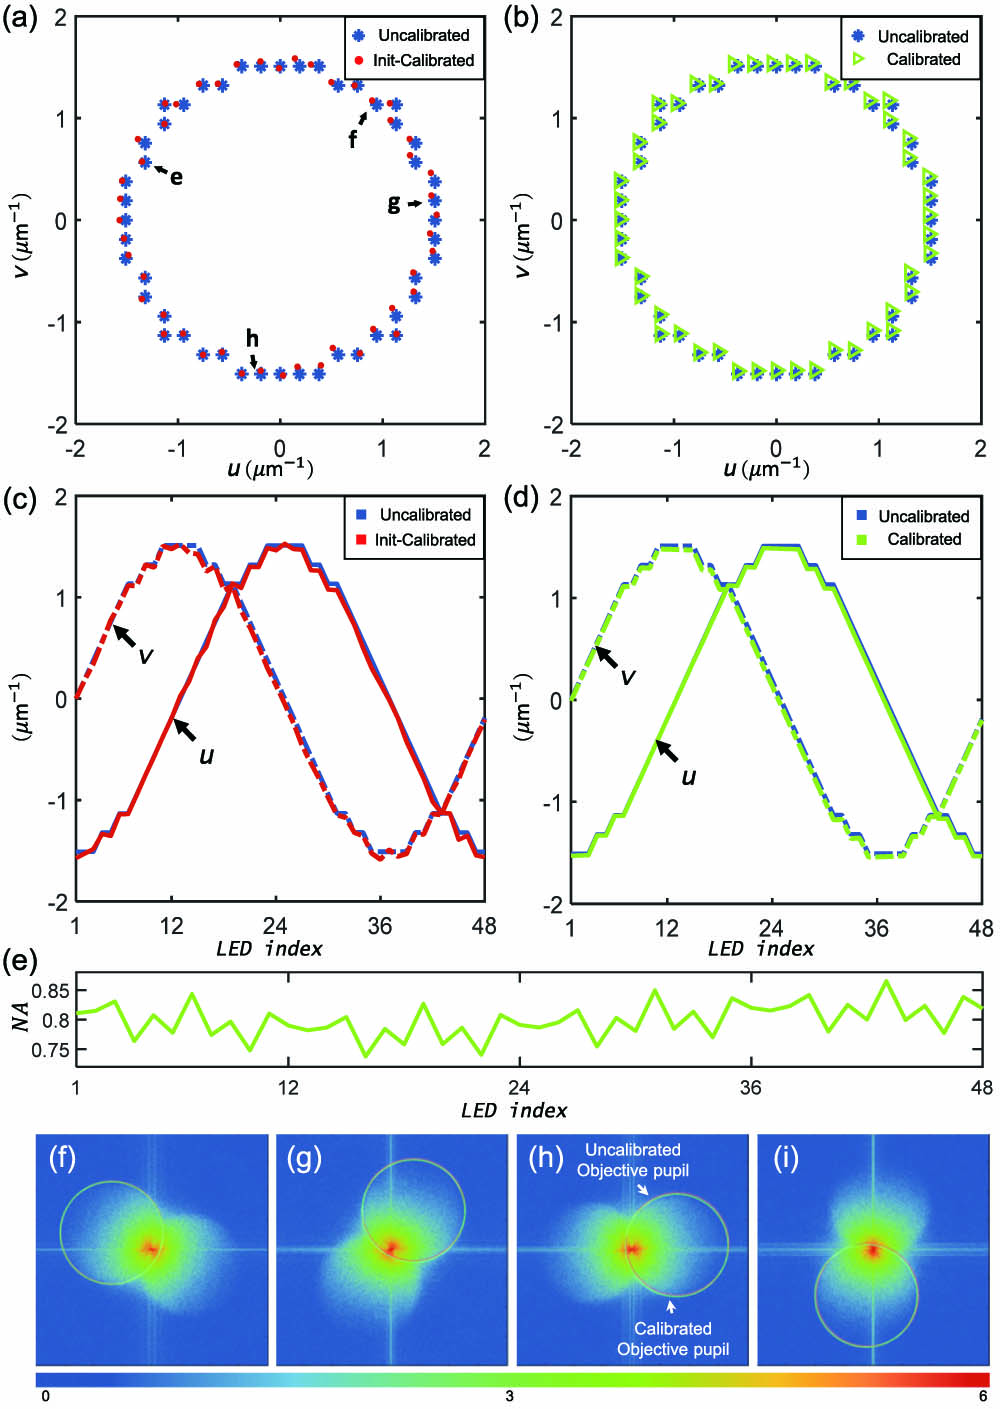
    Fig. 2. Demonstration of the proposed self-calibration method on an LED matrix with annular illumination pattern. (a), (b) The LED positions from manual alignment (termed uncalibrated, marked in blue star), initial guess of calibration (termed Init-calibrated, marked in red dot), and calibrated spatial frequency positions of LEDs (green triangle), plotted in the spatial frequency coordinates. (c), (d) 1D abscissa and the ordinate spatial illumination frequency plots of each LED on the annular pattern. Uncalibrated spatial frequency positions u, v (marked in blue line); Init-calibrated spatial frequency positions u, v (marked in red line); and calibrated spatial frequency positions u, v (marked in green line). (e) Calibrated numerical aperture of each LED element. (f)–(i) Captured Fourier spectrum using the corresponding LED (marked with arrows) along with calibrated pupil positions (marked by circles).
    3D absorption reconstruction of the USAF target. (a) Raw full-FOV image of the absorption USAF object under oblique illumination from the annular LED. (b), (c) Enlarged central groups of resolution features in the central slice of the 3D absorption stack of the USAF target. (e) Multiple axial sections of USAF 3D absorption reconstruction at different planes and cross-section intensity profile plot of the recovered USAF target. (f) 3D volume-rendered view of the reconstructed absorption distribution. Additional cross-sectional reconstruction and 3D volume rendering from different perspectives of view are shown in Visualization 1.
    Fig. 3. 3D absorption reconstruction of the USAF target. (a) Raw full-FOV image of the absorption USAF object under oblique illumination from the annular LED. (b), (c) Enlarged central groups of resolution features in the central slice of the 3D absorption stack of the USAF target. (e) Multiple axial sections of USAF 3D absorption reconstruction at different planes and cross-section intensity profile plot of the recovered USAF target. (f) 3D volume-rendered view of the reconstructed absorption distribution. Additional cross-sectional reconstruction and 3D volume rendering from different perspectives of view are shown in Visualization 1.
    Single-cell RI tomography of unstained HeLa cell clusters. (a) Recovered RI slice located at 0.4 μm z plane. The full HeLa cell volumetric reconstruction is shown in Visualization 2. (b) Depth color coding of 3D RI measurements of the sample in the field of view. (c)–(e) Reconstructed square subregions RI cross sections demonstrate the sectioning capability. Cellular membrane folds, cell boundaries, microtubules, and intracellular features are distinguishable (indicated by the white circles). The outlines of the nuclear envelope and nucleolus are recovered across multiple axial slices (indicated by the white arrows).
    Fig. 4. Single-cell RI tomography of unstained HeLa cell clusters. (a) Recovered RI slice located at 0.4 μm z plane. The full HeLa cell volumetric reconstruction is shown in Visualization 2. (b) Depth color coding of 3D RI measurements of the sample in the field of view. (c)–(e) Reconstructed square subregions RI cross sections demonstrate the sectioning capability. Cellular membrane folds, cell boundaries, microtubules, and intracellular features are distinguishable (indicated by the white circles). The outlines of the nuclear envelope and nucleolus are recovered across multiple axial slices (indicated by the white arrows).
    Tomographic characterization of unstained HT29. (a),(b) RI and absorption reconstruction of HT29 in 100× FOV at 0 μm z plane. Dark granules inside the cell contain highly absorbing features (indicated by the black circles). (c), (d) RI distribution of HT29 cell at different z planes for different square subregions. (e),(f) Line profiles across subcellular structures to quantify the reconstructed lateral resolution. Additional complex RI examples are shown in Visualization 3.
    Fig. 5. Tomographic characterization of unstained HT29. (a),(b) RI and absorption reconstruction of HT29 in 100× FOV at 0 μm z plane. Dark granules inside the cell contain highly absorbing features (indicated by the black circles). (c), (d) RI distribution of HT29 cell at different z planes for different square subregions. (e),(f) Line profiles across subcellular structures to quantify the reconstructed lateral resolution. Additional complex RI examples are shown in Visualization 3.
    Jiaji Li, Alex Matlock, Yunzhe Li, Qian Chen, Lei Tian, Chao Zuo. Resolution-enhanced intensity diffraction tomography in high numerical aperture label-free microscopy[J]. Photonics Research, 2020, 8(12): 1818
    Download Citation