• Photonics Research
  • Vol. 12, Issue 1, 33 (2024)
Zhuoyi Wang1, Xingyuan Lu1、5、*, Jianbo Gao1, Xuechun Zhao1, Qiwen Zhan2, Yangjian Cai3、4、6、*, and Chengliang Zhao1、7、*
Author Affiliations
  • 1School of Physical Science and Technology, Soochow University, Suzhou 215006, China
  • 2School of Optical-Electrical and Computer Engineering, University of Shanghai for Science and Technology, Shanghai 200093, China
  • 3Shandong Provincial Engineering and Technical Center of Light Manipulations & Shandong Provincial Key Laboratory of Optics and Photonic Device, School of Physics and Electronics, Shandong Normal University, Jinan 250358, China
  • 4Shandong Joint Research Center of Light Manipulation Science and Photonics Integrated Chip of East China Normal University and Shandong Normal University, East China Normal University, Shanghai 200241, China
  • 5e-mail: xylu@suda.edu.cn
  • 6e-mail: yangjian_cai@163.com
  • 7e-mail: zhaochengliang@suda.edu.cn
  • show less
    DOI: 10.1364/PRJ.499520 Cite this Article Set citation alerts
    Zhuoyi Wang, Xingyuan Lu, Jianbo Gao, Xuechun Zhao, Qiwen Zhan, Yangjian Cai, Chengliang Zhao. Coherence phase spectrum analyzer for a randomly fluctuated fractional vortex beam[J]. Photonics Research, 2024, 12(1): 33 Copy Citation Text show less
    Schematic diagram of the measurement of the coherence phase spectrum for a partially coherent fractional vortex beam. (a) Source plane with unknown topological charge. (b) Focal field. (c) Full source coherence information is restored. (d) Coherence phase spectrum by coherence phase is decomposed.
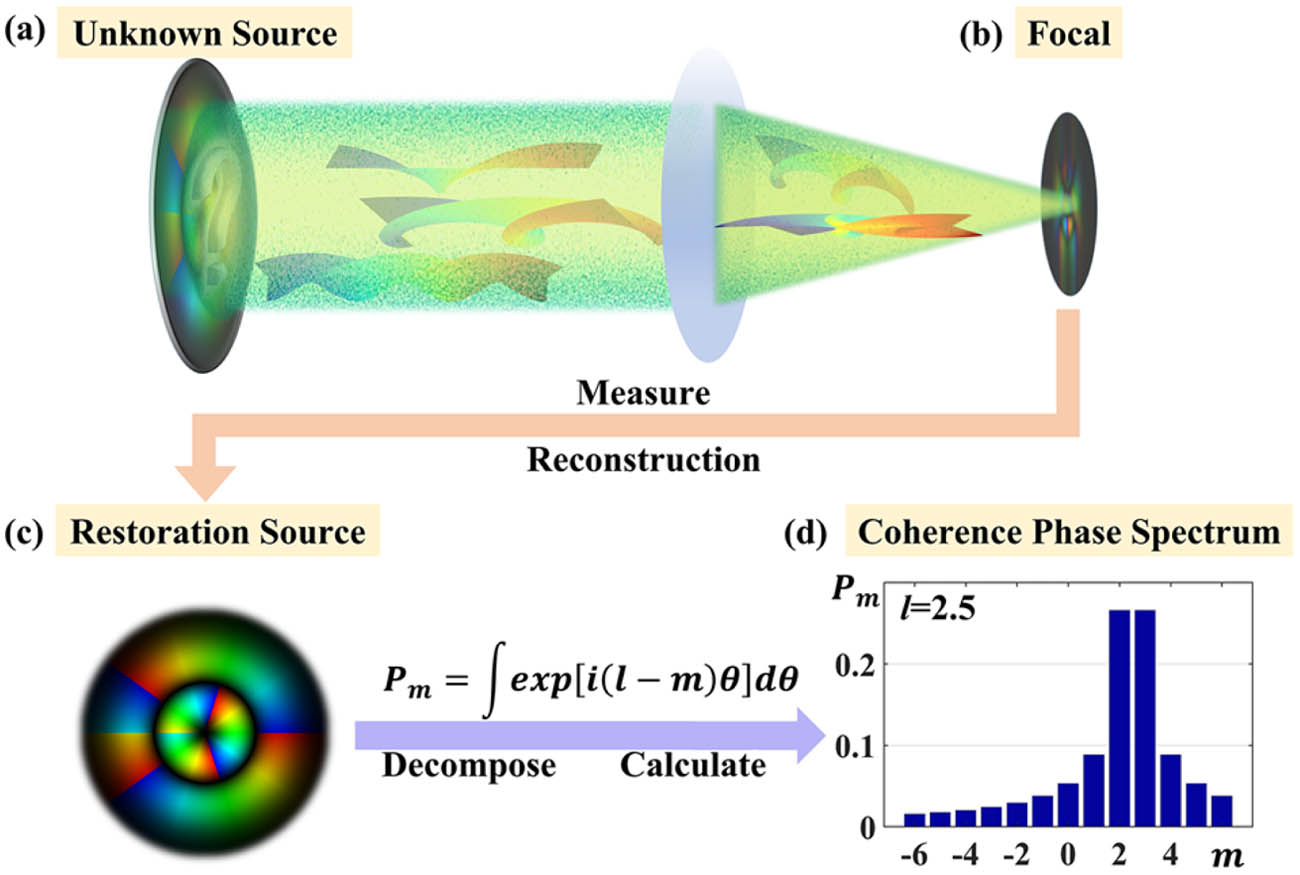
    Fig. 1. Schematic diagram of the measurement of the coherence phase spectrum for a partially coherent fractional vortex beam. (a) Source plane with unknown topological charge. (b) Focal field. (c) Full source coherence information is restored. (d) Coherence phase spectrum by coherence phase is decomposed.
    Experimental setup. (a) Generation of the partially coherent fractional vortex beams with different amplitudes and coherence lengths. BE, beam expander; L1, L2, L3, L4, thin lenses, with focal lengths of 100, 150, 300, and 300 mm, respectively; RGGD, rotating ground glass disk; BS, beam splitter; SLM, spatial light modulator; USAF (1951USAF resolution test chart) acts as an object; CCD1, charge coupled detector (ECO445); CCD2, electron-multiplying CCD. The first line of (b) and (c) is the hologram patterns loaded to the SLM for generating a fractional vortex beam with l=2.5. The second row of (d) and (e) is the experimental results of the focused fractional vortex beams (source intensities are inserted). PV, plane wave vortex beam; EGV, elliptic Gaussian vortex beam. LG, Laguerre–Gaussian vortex beam. High C, high coherence; δ0=1.5 mm. MC, medium coherence; δ0=0.4 mm. LC, low coherence; δ0=0.25 mm.
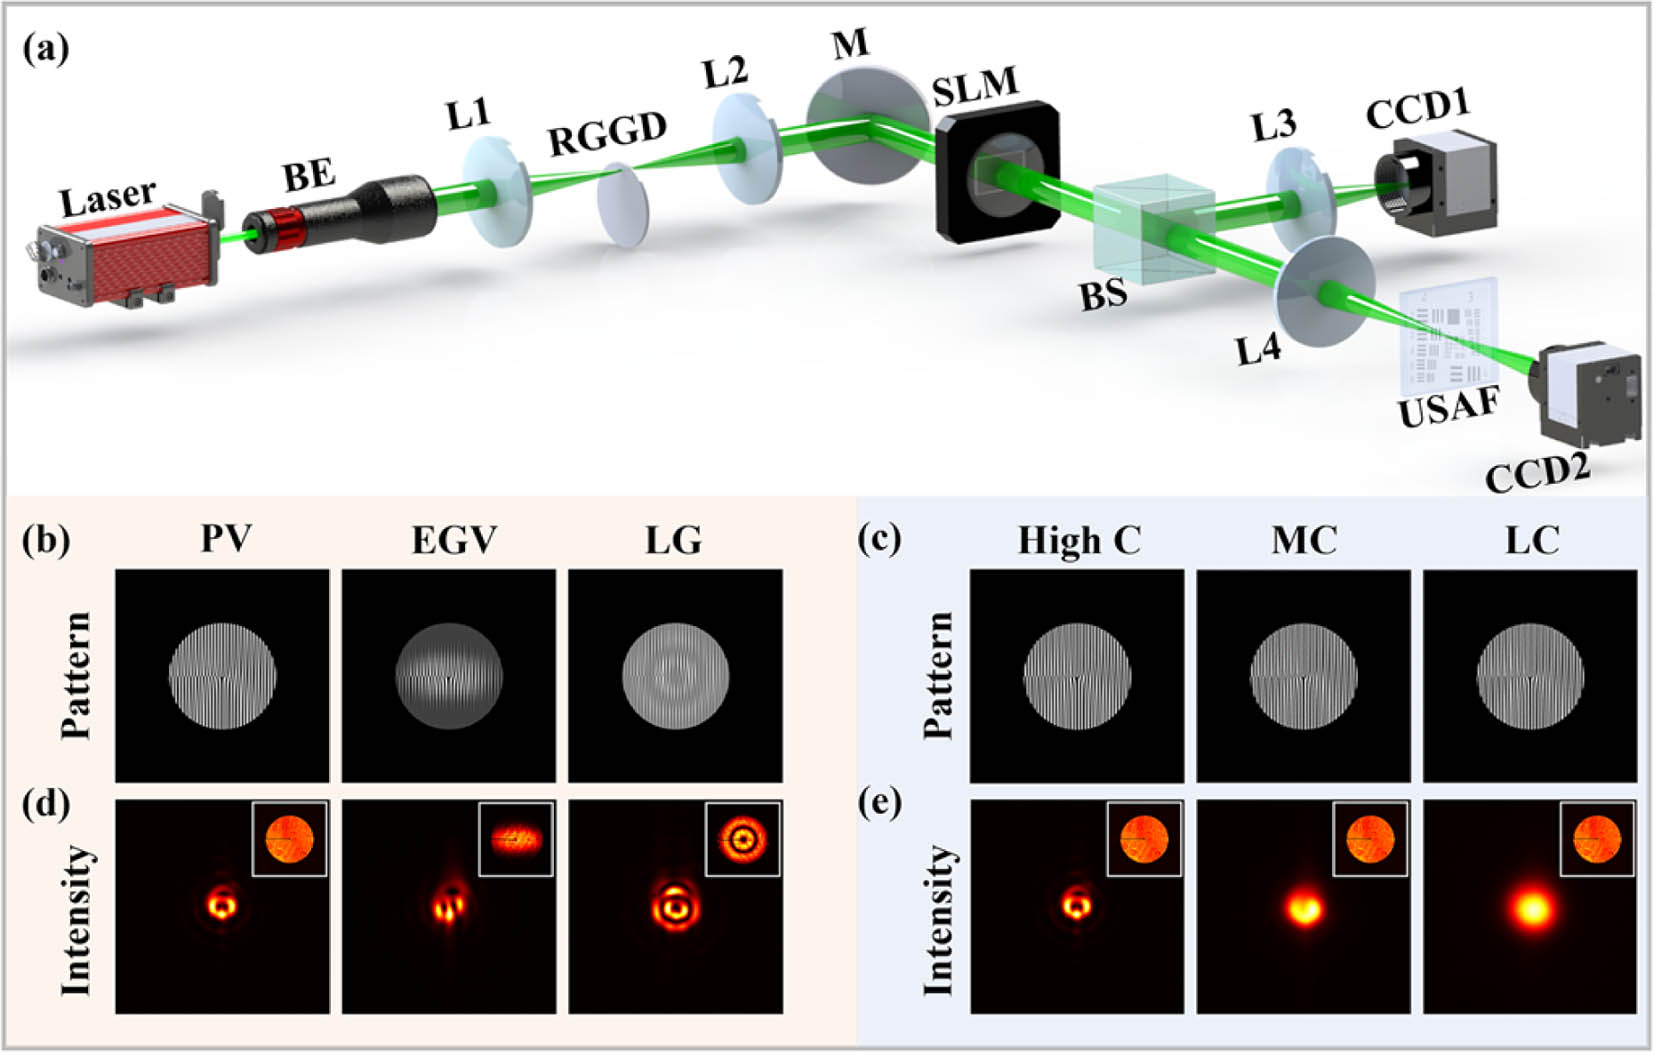
    Fig. 2. Experimental setup. (a) Generation of the partially coherent fractional vortex beams with different amplitudes and coherence lengths. BE, beam expander; L1, L2, L3, L4, thin lenses, with focal lengths of 100, 150, 300, and 300 mm, respectively; RGGD, rotating ground glass disk; BS, beam splitter; SLM, spatial light modulator; USAF (1951USAF resolution test chart) acts as an object; CCD1, charge coupled detector (ECO445); CCD2, electron-multiplying CCD. The first line of (b) and (c) is the hologram patterns loaded to the SLM for generating a fractional vortex beam with l=2.5. The second row of (d) and (e) is the experimental results of the focused fractional vortex beams (source intensities are inserted). PV, plane wave vortex beam; EGV, elliptic Gaussian vortex beam. LG, Laguerre–Gaussian vortex beam. High C, high coherence; δ0=1.5  mm. MC, medium coherence; δ0=0.4  mm. LC, low coherence; δ0=0.25  mm.
    Reconstruction of the source coherence phase. (a1) Focal average intensity, (a2) cross-spectral density amplitude, and (a3) cross-spectral density phase recorded in experiment. (a4) Source average intensity, (a5) cross-spectral density amplitude, and (a6) cross-spectral density phase reconstructed by inverse propagation to the source plane. (b1)–(b6) Cross-spectral density amplitude and cross-spectral density phase in the source plane for different amplitudes. (c1)–(c6) Cross-spectral density amplitude and phase in the source plane for different coherence lengths.
    Fig. 3. Reconstruction of the source coherence phase. (a1) Focal average intensity, (a2) cross-spectral density amplitude, and (a3) cross-spectral density phase recorded in experiment. (a4) Source average intensity, (a5) cross-spectral density amplitude, and (a6) cross-spectral density phase reconstructed by inverse propagation to the source plane. (b1)–(b6) Cross-spectral density amplitude and cross-spectral density phase in the source plane for different amplitudes. (c1)–(c6) Cross-spectral density amplitude and phase in the source plane for different coherence lengths.
    Coherence phase spectrum. Theoretical and experimental coherence phase spectra with (a)–(c) different amplitude envelopes and (d)–(f) different degrees of coherence.
    Fig. 4. Coherence phase spectrum. Theoretical and experimental coherence phase spectra with (a)–(c) different amplitude envelopes and (d)–(f) different degrees of coherence.
    Accuracy and applicability. (a) Accuracy verification; (b), (c) integer and larger topological charge measurements.
    Fig. 5. Accuracy and applicability. (a) Accuracy verification; (b), (c) integer and larger topological charge measurements.
    Application in optical encryption. Conceptual illustration of the optical information encoding scheme using fractional vortex beams.
    Fig. 6. Application in optical encryption. Conceptual illustration of the optical information encoding scheme using fractional vortex beams.
    Zhuoyi Wang, Xingyuan Lu, Jianbo Gao, Xuechun Zhao, Qiwen Zhan, Yangjian Cai, Chengliang Zhao. Coherence phase spectrum analyzer for a randomly fluctuated fractional vortex beam[J]. Photonics Research, 2024, 12(1): 33
    Download Citation