• Photonics Research
  • Vol. 12, Issue 1, 33 (2024)
Zhuoyi Wang1, Xingyuan Lu1、5、*, Jianbo Gao1, Xuechun Zhao1, Qiwen Zhan2, Yangjian Cai3、4、6、*, and Chengliang Zhao1、7、*
Author Affiliations
  • 1School of Physical Science and Technology, Soochow University, Suzhou 215006, China
  • 2School of Optical-Electrical and Computer Engineering, University of Shanghai for Science and Technology, Shanghai 200093, China
  • 3Shandong Provincial Engineering and Technical Center of Light Manipulations & Shandong Provincial Key Laboratory of Optics and Photonic Device, School of Physics and Electronics, Shandong Normal University, Jinan 250358, China
  • 4Shandong Joint Research Center of Light Manipulation Science and Photonics Integrated Chip of East China Normal University and Shandong Normal University, East China Normal University, Shanghai 200241, China
  • 5e-mail: xylu@suda.edu.cn
  • 6e-mail: yangjian_cai@163.com
  • 7e-mail: zhaochengliang@suda.edu.cn
  • show less
    DOI: 10.1364/PRJ.499520 Cite this Article Set citation alerts
    Zhuoyi Wang, Xingyuan Lu, Jianbo Gao, Xuechun Zhao, Qiwen Zhan, Yangjian Cai, Chengliang Zhao. Coherence phase spectrum analyzer for a randomly fluctuated fractional vortex beam[J]. Photonics Research, 2024, 12(1): 33 Copy Citation Text show less

    Abstract

    Fractional vortex beams exhibit a higher degree of modulation dimensions than conventional vortices, thus inheriting superior anti-turbulent transmission properties through the incorporation of additional coherence modulation. However, aliasing the mixed modes induced by coherence degradation makes the quantitative measurement of the topological charge in fractional vortex beams challenging. In this study, a coherence phase spectrum was introduced, and experimental demonstrations to quantitatively determine the fractional topological charge of partially coherent fractional vortex beams were performed. By leveraging the four-dimensional measurement of a partially coherent light field, the source coherence function was inversely reconstructed, and fractional topological charges were determined with high precision by extracting the phase spectrum of the coherence function. Laguerre–Gaussian, elliptical Gaussian, and plane-wave-fraction vortex beams with various degrees of coherence were used to demonstrate measurement precision. The proposed method is applicable to X-rays and electron vortices. It has potential applications in optical encryption, high-capacity optical communication, and quantum entanglement.

    1. INTRODUCTION

    As pointed out by Allen in 1992, a vortex beam with a helical phase front carries an orbital angular momentum (OAM) of l per photon, where is the reduced Planck’s constant, and l is the topological charge [1]. In most studies related to optical vortices, topological charges are commonly limited to integer values, but the values of the topological charges can be non-integral, that is, fractional topological charge [24]. Fractional vortex beams possess special optical properties that are significantly different from those of integer vortex beams [5]. The topological charge values are continuous and can be used to address the explosive growth in communication requirements [69] and realize ultrahigh-dimensional entanglement [10,11]. In addition, fractional vortex beams have radial openings in annular light rings, which enable complex optical manipulations [12,13].

    Given the broad applications of fractional vortex beams, various techniques have been proposed to measure topological charges, such as diffraction, interference [1418], deep learning [19,20], and coordinate transformation [21,22]. For the fully coherent case, the accuracy of these measurement schemes can reach up to 0.1 or even 0.01 with the help of a deep learning algorithm. However, decoherence, which often occurs in a turbulent or randomly fluctuating light field [23,24], is not considered in these schemes. Recently, the advantages of pre-modulating the spatial coherence of light sources have been widely studied, such as anti-turbulence propagation [2530], and the accuracy improvement of recognizing the integer topological charge [31]. Nevertheless, the aforementioned methods encounter obstacles in detecting fractional topological charges owing to the compromised coherence and varying amplitudes associated with such conditions. OAM correlation calculation [3234] was used to approximately identify the fractional topological charge. However, to the best of our knowledge, the quantitative measurement of the topological charge is still quite challenging for partially coherent fractional vortex beams. The complex amplitude and phase evolution characteristics change significantly during the propagation process; however, they exhibit perfect helical phase distributions in source planes. Thus, the topological charge measurement is more accurate in the source plane than in any other propagation plane.

    Consequently, the coherence phase spectrum was introduced and experimentally measured using the reconstructed source coherence function. This measurement has been proven to be quantitatively relevant to the value of the fractional topological charge. By measuring the complete four-dimensional coherence information in the far field, the source coherence information of partially coherent fractional vortex beams was inversely reconstructed, and the coherence phase spectrum was calculated. Then, the measurement of the fractional topological charge was presented for various coherence and amplitude envelopes, such as Laguerre–Gaussian and elliptical Gaussian, for which the accuracy is finer than 0.1. The experimental results were in good agreement with the theoretical analysis. For potential applications, we verified the feasibility of expanding the encryption capacity. This study provides new insights for accurate topological charge measurements and paves the way for the practical application of fractional vortex beams in high-dimensional quantum entanglement and optical communication.

    2. METHODS

    A. Theory

    In the space–frequency domain, the coherence properties of partially coherent beams are characterized by the cross-spectral density function. For a partially coherent vortex beam in the source plane, the cross-spectral density function can be written as [35] W(r1,θ1,r2,θ2)=A(r1)A(r2)exp[(r1r2)/(2δ02)]exp(ilθ1+ilθ2),where A(r) denotes the amplitude distribution. By varying A(r), various partially coherent vortex beams have been proposed [36]. r1 and r2 are two arbitrary vector coordinates in the source plane, and θ represents the angular coordinate. δ0 is the spatial coherence width, and l denotes the value of topological charge. Equation (1) reveals that the phase of the source cross-spectral density in a partially coherent fractional vortex beam contains information about the fractional topological charge, whereas the characteristics of the cross-spectral density undergo significant changes throughout the propagation process, as shown in Figs. 1(a) and 1(b).

    Schematic diagram of the measurement of the coherence phase spectrum for a partially coherent fractional vortex beam. (a) Source plane with unknown topological charge. (b) Focal field. (c) Full source coherence information is restored. (d) Coherence phase spectrum by coherence phase is decomposed.

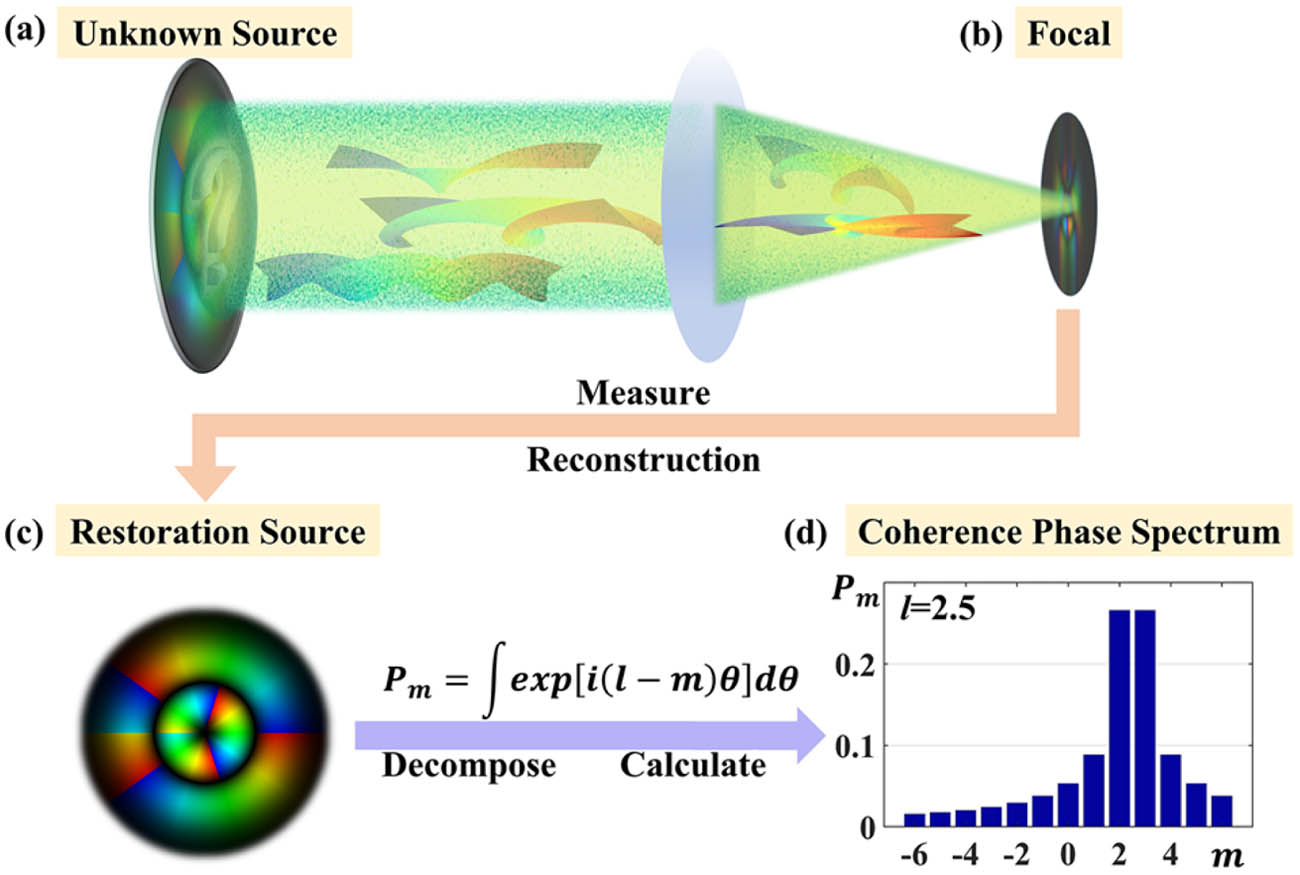
    Figure 1.Schematic diagram of the measurement of the coherence phase spectrum for a partially coherent fractional vortex beam. (a) Source plane with unknown topological charge. (b) Focal field. (c) Full source coherence information is restored. (d) Coherence phase spectrum by coherence phase is decomposed.

    The fractional topological charge information is difficult to obtain, as shown in Fig. 1(b), unless the source cross-spectral density function is recovered, which is the most challenging part. Once the four-dimensional cross-spectral density is measured in the propagation plane, the source cross-spectral density function can be reconstructed, and the phase, which is called the coherence phase, can be easily extracted [Fig. 1(c)]. The decomposition of the coherence phase, that is, the coherence phase spectrum, for a partially coherent vortex beam was investigated, as shown in Fig. 1(d). For a fixed reference point, the phase term in Eq. (1) is exp(ilθ). Using the basis of the integer OAM states, the phase term can be decomposed as [2] exp(ilθ)=exp(ilπ)sin(πl)πm=+exp(imθ)lm,where m is an integer. Thus, the coherence phase spectrum is defined as Pm=|exp(ilθ)exp(imθ)dθ|.

    Using the orthogonality of the integer OAM states, we obtained Pm=|Cl/(lm)|, where Cl is a constant with respect to l. The intensity of Pm reaches its peak value when m=l0 or m=l0+1, which is the nearest integer to the fraction l (l=l0+a; a is the fractional part). In other words, the two highest peaks were Pl0 and Pl1. The intensities of the other OAM states decay as the integer m moves away from the fraction l. The exact value of the detected fractional vortex can be derived as follows: l=l0Pl0+l1Pl1Pl0+Pl1.

    Equation (4) is one of the main conclusions of this study. Although only the two highest peaks are used for calculation, the accuracy of a certain coefficient Pm is also related to the accuracy of each coefficient, as the coefficient value is globally normalized. If we can accurately extract the coherence phase of the partially coherent beam, we can plot the coherence phase spectrum using Eq. (3), as shown in Fig. 1(d). The quantitative relationship between the fractional topological charge and coherence phase spectrum decomposition in Eqs. (2)–(4) works only in the source plane. Once the propagation occurs, the phase term becomes disordered.

    B. Experimental Setup

    Multimode ptychography was introduced to measure the cross-spectral density of partially coherent light fields [37,38]. The mixed modes contained in a partially coherent fractional vortex beam were reconstructed from a set of collected diffraction patterns. For a linear and time-invariant system with a measurable transmission matrix, the modes in the focal field can be inversely transmitted to the source plane through angular spectrum propagation. The cross-spectral density and its coherence phase spectrum were calculated using Eq. (3). Finally, the topological charge was obtained using Eq. (4).

    The experimental setup for generating and measuring different partially coherent vortex beams is illustrated in Fig. 2. A fully coherent laser beam is emitted from a semiconductor laser (Ventus HR 532 nm) and expanded using a beam expander. The expanded beam is then focused on a rotating ground-glass disk by a thin lens L1 (f1=100  mm), and the beam can be regarded as spatially incoherent immediately after passing through the rotating ground-glass disk, if the diameter of the beam spot on the rotating ground-glass disk is larger than the inhomogeneity scale of the ground glass, which was satisfied in our case. As per the Van Cittert–Zernike theorem, after collimation with the thin lens L2 (f2=150  mm), the generated incoherent beam becomes partially coherent. The coherence length δ0 is determined by the size of the focused beam spot on the rotating ground-glass disk and disk roughness.

    Experimental setup. (a) Generation of the partially coherent fractional vortex beams with different amplitudes and coherence lengths. BE, beam expander; L1, L2, L3, L4, thin lenses, with focal lengths of 100, 150, 300, and 300 mm, respectively; RGGD, rotating ground glass disk; BS, beam splitter; SLM, spatial light modulator; USAF (1951USAF resolution test chart) acts as an object; CCD1, charge coupled detector (ECO445); CCD2, electron-multiplying CCD. The first line of (b) and (c) is the hologram patterns loaded to the SLM for generating a fractional vortex beam with l=2.5. The second row of (d) and (e) is the experimental results of the focused fractional vortex beams (source intensities are inserted). PV, plane wave vortex beam; EGV, elliptic Gaussian vortex beam. LG, Laguerre–Gaussian vortex beam. High C, high coherence; δ0=1.5 mm. MC, medium coherence; δ0=0.4 mm. LC, low coherence; δ0=0.25 mm.

    Figure 2.Experimental setup. (a) Generation of the partially coherent fractional vortex beams with different amplitudes and coherence lengths. BE, beam expander; L1, L2, L3, L4, thin lenses, with focal lengths of 100, 150, 300, and 300 mm, respectively; RGGD, rotating ground glass disk; BS, beam splitter; SLM, spatial light modulator; USAF (1951USAF resolution test chart) acts as an object; CCD1, charge coupled detector (ECO445); CCD2, electron-multiplying CCD. The first line of (b) and (c) is the hologram patterns loaded to the SLM for generating a fractional vortex beam with l=2.5. The second row of (d) and (e) is the experimental results of the focused fractional vortex beams (source intensities are inserted). PV, plane wave vortex beam; EGV, elliptic Gaussian vortex beam. LG, Laguerre–Gaussian vortex beam. High C, high coherence; δ0=1.5  mm. MC, medium coherence; δ0=0.4  mm. LC, low coherence; δ0=0.25  mm.

    To modulate the amplitude and phase profile of the partially coherent beam, a spatial light modulator (HDSLM85T) with a pixel pitch of 8 μm is used. Plane-wave, elliptical Gaussian, and Laguerre–Gaussian vortex beams with different coherence lengths were generated. In the experiment, we loaded the spatial light modulator with different holograms [Figs. 2(b) and 2(c)] and limited its area to a hard-edged aperture. The modulated beam passed through a beam splitter (BS) and was focused by a lens (L3). The intensity was recorded using CCD1, as shown in Fig. 2(d). The intensity patterns of the experimental source are shown in the insets of the Fig. 2. In the source plane, the intensity of the plane-wave vortex beam was evenly distributed. However, in the focal field, the intensity was distributed symmetrically with multiple singularities. For an elliptical Gaussian vortex beam, the amplitude of the source plane is affected by the elliptical Gaussian amplitude. Thus, the focal field distribution is deformed and has an asymmetric structure. The intensity pattern of a fractional vortex beam has a radial opening in the annular ring encompassing the dark core near the source plane and gaps in the focal plane. A fractional Laguerre–Gaussian beam has an outer ring structure in both the focal field and source plane, owing to the radial index of p=1. Furthermore, as shown in Fig. 2(e), with the decrease of δ0, the focal intensity finally becomes a Gaussian profile.

    Considering the focal plane as the measuring plane, a scattering object (USAF) was placed perpendicular to the optical axis, and the diffraction intensity was measured using CCD2 (EMCCD, iXon Life, Oxford). The modal decomposition was based on a multimode ptychographic iterative engine [37,38]. Subsequently, the partially coherent fractional vortex beam was fully characterized, including the average intensity and cross-spectral density. The distance between the USAF and CCD2 was 146 mm. Ptychographic scanning was performed to collect additional diffraction information. The USAF was fixed on a two-dimensional mobile stage (CONEX-MFACC Newport), and 400 raw diffraction patterns were captured using 20×20 overlapping scans with step size set as 40 μm. The partially coherent light beam focused on the scattering object is the target to be measured, which also acts as a probe, and its beam width is around 400 μm.

    As a partially coherent light field, the probe can be regarded as the incoherent superposition of multi modes, that is, W(ρ1,ρ2)=nEn(ρ1)En*(ρ2). On the camera plane, each recorded intensity I0(k) can also be treated as the incoherent superposition of diffraction patterns for different modes, that is, I0(k)=nψn(k)ψn*(k). Then, the modes on the object plane can be updated using a multi-probe ptychography iterative engine [37]. Each mode on the camera plane ψn(k) and object plane En(ρ) can be respectively updated as ψni(k)=I0(k)n=1Nψni(k)ψn*i(k)ψni(k),Eni+1(ρ)=Eni(ρ)+βO*(ρ)|O(ρ)|max2[Φni(ρ)Φni(ρ)],where Φni(ρ)=F1{ψni(k)}. ρ is the coordinate on the object plane, and k is the coordinate on the detector plane. I0(k) represents the experimentally recorded diffraction intensity. ψni(k) is the updated complex diffraction field. “n” means the nth mode, whose total number is N. “i” is the ith iteration. β is the update coefficient, which was set as 0.9 in this work. Based on Eq. (5), En(ρ) was reconstructed after 100 iterations. Furthermore, En(r) was obtained by the inverse transmission of En(ρ). For certain reference, the cross-spectral density can be calculated by W(r1,r0)=nEn*(r0)En(r1), and the phase is Arg[W(r1,r0)], where “Arg” means phase operation. The reconstruction pixel size satisfies the formula Δx=λz/L, and the ideal resolution is around two times the pixel size. z represents the distance from the scattering object to the camera, and λ represents the wavelength of the beam. L represents the camera total size. Therefore, the larger the camera size, the higher the resolution.

    3. RESULTS

    An example of partially coherent fractional vortex beams with δ0=1.5  mm is presented here. Figure 3(a1) shows the average focal intensity reconstructed from the measured modes. Furthermore, the amplitude and phase of the focal cross-spectral density, that is, W(r,0), can be calculated as shown in Figs. 3(a2) and 3(a3). However, there is no visual information for the quantitative calculation of the topological charges.

    Reconstruction of the source coherence phase. (a1) Focal average intensity, (a2) cross-spectral density amplitude, and (a3) cross-spectral density phase recorded in experiment. (a4) Source average intensity, (a5) cross-spectral density amplitude, and (a6) cross-spectral density phase reconstructed by inverse propagation to the source plane. (b1)–(b6) Cross-spectral density amplitude and cross-spectral density phase in the source plane for different amplitudes. (c1)–(c6) Cross-spectral density amplitude and phase in the source plane for different coherence lengths.

    Figure 3.Reconstruction of the source coherence phase. (a1) Focal average intensity, (a2) cross-spectral density amplitude, and (a3) cross-spectral density phase recorded in experiment. (a4) Source average intensity, (a5) cross-spectral density amplitude, and (a6) cross-spectral density phase reconstructed by inverse propagation to the source plane. (b1)–(b6) Cross-spectral density amplitude and cross-spectral density phase in the source plane for different amplitudes. (c1)–(c6) Cross-spectral density amplitude and phase in the source plane for different coherence lengths.

    The transmission matrix is calculated using the propagation distance and focal length of the lens. The cross-spectral density of the source plane can then be reconstructed using the mixed modes of the focal field via angular spectrum propagation. As shown in Figs. 3(a4)–3(a6), the source intensity, amplitude, and phase of the cross-spectral density were calculated by inversely transmitting the focal electric-fields to the source plane. In particular, the aperture boundary can be clearly observed in Fig. 3(a4). We can clearly observe phase singularities and fractional phase jumps from the phase pattern. Therefore, the topological charge is roughly obtained by the loop integral of the phase, written as l=12πϕ(r)·dr [13]. However, both the pixel size and selected radius affect the accuracy. Subsequently, the coherence phase spectrum is introduced in the following quantitative determination of the topological charge. The phase was extracted from the cross-spectral density, and the coherence phase spectrum was analyzed.

    A. Different Amplitude Envelopes

    To verify the universality of this scheme, the topological charges of partially coherent fractional vortex beams with different amplitudes were measured, including plane wave, elliptical Gaussian, and Laguerre–Gaussian fractional vortex beams (l=2.5). Figures 3(b1)–3(b6) show the reconstructed cross-spectral densities in the source plane. The amplitudes were different, whereas the three beams exhibited similar central phase distributions. Thus, the coherent phase spectrum was not influenced by the amplitude envelope. The corresponding coherence phase spectrum is shown in Figs. 4(a)–4(c), where the blue and red histograms denote the theoretical and experimental results. The measured topological charge is marked above each subfigure, and it matches the true value well.

    Coherence phase spectrum. Theoretical and experimental coherence phase spectra with (a)–(c) different amplitude envelopes and (d)–(f) different degrees of coherence.

    Figure 4.Coherence phase spectrum. Theoretical and experimental coherence phase spectra with (a)–(c) different amplitude envelopes and (d)–(f) different degrees of coherence.

    B. Different Coherence Lengths

    Different spatial coherence widths are verified. Figure 2(e) shows experimental intensity distributions of the generated partially coherent fractional vortex beam at the focal and source planes for different values of δ0. With a decrease in the initial coherence width, the beam waist amplitude decreases gradually, as shown in Figs. 3(c1)–3(c3). Figures 3(c4)–3(c6) show that the phase is affected by the coherence and that the phase outside the amplitude envelope is disordered. Therefore, we considered the region within the amplitude envelope to calculate the coherence phase spectrum. Figures 4(d)–4(f) show the measured coherence phase spectra and corresponding topological charge of the fractional vortex beams under various degrees of coherence. These measurements exhibit only minor differences when compared with the true value (l=2.5) of the coherence phase spectrum.

    C. Accuracy and Applicability

    By comparing the results in Fig. 4, where the true topological charge is 2.5, the accuracy is guaranteed to be finer than 0.1. In addition, Fig. 5(a) shows the mean value of 10 experimental measurements for l=2.8, from which the standard deviation was calculated (red error bars). This also shows that the accuracy of the experimental results was less than 0.1. Furthermore, the applicability of the proposed method for vortex beams with an integer topological charge (l=2) and a larger fractional topological charge (l=10.8) was verified, as shown in Figs. 5(b) and 5(c). Considering the divergence of the beam after long-distance propagation in real-world scenarios and the limited numerical aperture of the acquisition system, the accuracy will be reduced. As shown in https://opticapublishing.figshare.com/s/e8cfea5c50a4a85e26eaVisualization 1, having a finite sized diffraction pattern implies a loss of diffraction information, which leads to phase distortion and errors in the coherent phase spectrum obtained from inverse transmission calculations. These issues can be addressed by a sufficiently large light beam acquisition system, such as a larger lens.

    Accuracy and applicability. (a) Accuracy verification; (b), (c) integer and larger topological charge measurements.

    Figure 5.Accuracy and applicability. (a) Accuracy verification; (b), (c) integer and larger topological charge measurements.

    D. Applications in Optical Encryption

    Free-space optical encoding based on a partially coherent fractional vortex beam with a channel interval of 0.1 was successfully realized, as shown in Fig. 6. A random 26-ary letter was propagated using 26 topological charges (varying from 1 to 3.5). Subsequently, on the transmitter side, we generated the desired fractional vortex beam sequence by switching the corresponding patterns loaded on the spatial light modulator. After encoding, the fractional vortex beam sequence propagates and finally arrives at the receiver. Subsequently, the topological charge of the fractional vortex beam was measured at the receiver side. For example, the message “Hello” was encoded using the corresponding 26-ary encoding from the lookup table, and the corresponding fractional vortex beam was sent. The measured topological charges at the receiver side (1.7, 1.4, 2.1, 2.1, and 2.4) precisely matched the transmitted topological charges, confirming the successful implementation of free-space communication using the proposed encoding/decoding scheme.

    Application in optical encryption. Conceptual illustration of the optical information encoding scheme using fractional vortex beams.

    Figure 6.Application in optical encryption. Conceptual illustration of the optical information encoding scheme using fractional vortex beams.

    4. CONCLUSIONS

    A coherence phase spectrum was introduced to quantitatively measure the topological charges of partially coherent fractional vortex beams. Experimental measurement of the four-dimensional cross-spectral density on the focal plane was performed via multimode ptychography. Subsequently, the coherent phase spectrum was extracted by recovering the source cross-spectral density function. The accuracy of the fractional topological charge calculated based on the coherence phase spectrum was finer than 0.1. Proof-of-principle experiments were conducted to evaluate the performance of fractional vortex beams with varying amplitudes and degrees of coherence. The application of optical encryption with fractional vortex beams was also presented. These experimental results demonstrated that the method has good universality, accuracy, and practicability.

    In this work, ideal experimental conditions were considered, such as short propagation distance, low or absence of atmospheric turbulence, and known transmission matrix of the system. It ensures the probability for back-propagation calculation of the cross-spectral density function to the source plane, where the coherence phase spectrum has a quantitative relationship with the fractional topological charge. More challengingly, the outdoor turbulent environment will bring difficulties to the inversion of the cross-spectral density and the measurement of topological charge. Considering real-world scenarios, the measurement accuracy will be highly dependent on propagation distance, beam size, decoherence, and atmospheric turbulence. The transmission matrix of the atmospheric turbulence should be measured in real-time to help the inverse calculation [39,40]. The introduction of a deep learning algorithm can also help improve the efficiency and extend the accuracy [19,20]. Furthermore, the performance of different coherence structures of partially coherent vortex beams in atmospheric turbulence can be further studied and compared based on the scheme proposed in this work [41]. The proposed method is also expected to be extended to X-rays and electron vortices.

    References

    [1] L. Allen, M. Beijersbergen, R. Spreeuw. Orbital angular momentum of light and the transformation of Laguerre-Gaussian laser modes. Phys. Rev. A, 45, 8185-8189(1992).

    [2] M. Berry. Optical vortices evolving from helicoidal integer and fractional phase steps. J. Opt. A, 6, 259-268(2004).

    [3] J. Chen, C. Wan, Q. Zhan. Engineering photonic angular momentum with structured light: a review. Adv. Photon., 3, 064001(2021).

    [4] X. Fang, H. Yang, W. Yao. High-dimensional orbital angular momentum multiplexing nonlinear holography. Adv. Photon., 3, 015001(2021).

    [5] H. Zhang, J. Zeng, X. Lu. Review on fractional vortex beam. Nanophotonics, 11, 241-273(2022).

    [6] J. Wang, J. Yang, I. Fazal. Terabit free-space data transmission employing orbital angular momentum multiplexing. Nat. Photonics, 6, 488-496(2012).

    [7] M. Erhard, R. Fickler, M. Krenn. Twisted photons: new quantum perspectives in high dimensions. Light Sci. Appl., 7, 17146(2018).

    [8] W. Zhang, L. Wang, S. Zhao. Capacity performance of the underwater system based fractional orbital angular momentum. IEEE International Conference on Communications Workshops, 1-4(2019).

    [9] J. Wang. Advances in communications using optical vortices. Photon. Res., 4, B14-B28(2016).

    [10] A. Mair, A. Vaziri, G. Weihs. Entanglement of the orbital angular momentum states of photons. Nature, 412, 313-316(2001).

    [11] S. Oemrawsingh, X. Ma, D. Voigt. Experimental demonstration of fractional orbital angular momentum entanglement of two photons. Phys. Rev. Lett., 95, 240501(2005).

    [12] G. Tkachenko, M. Chen, K. Dholakia. Is it possible to create a perfect fractional vortex beam?. Optica, 4, 330-333(2017).

    [13] G. Gbur. Fractional vortex Hilbert’s hotel. Optica, 3, 222-225(2016).

    [14] D. Deng, M. Lin, Y. Li. Precision measurement of fractional orbital angular momentum. Phys. Rev. Appl., 12, 014048(2019).

    [15] J. Leach, M. Padgett, S. Barnett. Measuring the orbital angular momentum of a single photon. Phys. Rev. Lett., 88, 257901(2002).

    [16] J. Zhu, P. Zhang, D. Fu. Probing the fractional topological charge of a vortex light beam by using dynamic angular double slits. Photon. Res., 4, 187-190(2016).

    [17] H. Wang, Z. Zhan, F. Hu. Intelligent optoelectronic processor for orbital angular momentum spectrum measurement. PhotoniX, 4, 9(2023).

    [18] K. Saitoh, Y. Hasegawa, K. Hirakawa. Measuring the orbital angular momentum of electron vortex beams using a forked grating. Phys. Rev. Lett., 111, 074801(2013).

    [19] Z. Liu, S. Yan, H. Liu. Superhigh-resolution recognition of optical vortex modes assisted by a deep-learning method. Phys. Rev. Lett., 123, 183902(2019).

    [20] G. Jing, L. Chen, P. Wang. Recognizing fractional orbital angular momentum using feed forward neural network. Results Phys., 28, 104619(2021).

    [21] G. Berkhout, M. Lavery, J. Courtial. Efficient sorting of orbital angular momentum states of light. Phys. Rev. Lett., 105, 153601(2010).

    [22] M. Mirhosseini, M. Malik, Z. Shi. Efficient separation of the orbital angular momentum eigenstates of light. Nat. Commun., 4, 2781(2013).

    [23] P. Thibault, A. Menzel. Reconstructing state mixtures from diffraction measurements. Nature, 494, 68-71(2013).

    [24] B. Stoklasa, L. Motka, J. Rehacek. Wavefront sensing reveals optical coherence. Nat. Commun., 5, 3275(2014).

    [25] G. Gbur, E. Wolf. Spreading of partially coherent beams in random media. J. Opt. Soc. Am. A, 19, 1592-1598(2002).

    [26] T. Shirai, A. Dogariu, E. Wolf. Mode analysis of spreading of partially coherent beams propagating through atmospheric turbulence. J. Opt. Soc. Am. A, 20, 1094-1102(2003).

    [27] J. Yu, X. Zhu, F. Wang. Experimental study of reducing beam wander by modulating the coherence structure of structured light beams. Opt. Lett., 44, 4371-4374(2019).

    [28] S. Lin, C. Wang, X. Zhu. Propagation of radially polarized Hermite non-uniformly correlated beams in a turbulent atmosphere. Opt. Express, 28, 27238-27249(2020).

    [29] R. Lin, H. Yu, X. Zhu. The evolution of spectral intensity and orbital angular momentum of twisted Hermite Gaussian Schell model beams in turbulence. Opt. Express, 28, 7152-7164(2020).

    [30] D. Peng, Z. Huang, Y. Liu. Optical coherence encryption with structured random light. PhotoniX, 2, 6(2021).

    [31] J. Zhu, H. Zhang, Z. Wang. Coherence singularity and evolution of partially coherent Bessel–Gaussian vortex beams. Opt. Express, 31, 9308-9318(2023).

    [32] Z. Yang, O. Magaña-Loaiza, M. Mirhosseini. Digital spiral object identification using random light. Light Sci. Appl., 6, e17013(2017).

    [33] L. Chen, J. Lei, J. Romero. Quantum digital spiral imaging. Light Sci. Appl., 3, e153(2014).

    [34] K. Huang, H. Liu, S. Restuccia. Spiniform phase-encoded metagratings entangling arbitrary rational-order orbital angular momentum. Light Sci. Appl., 7, 17156(2018).

    [35] L. Mandel, E. Wolf. Optical Coherence and Quantum Optics(1995).

    [36] Y. Chen, F. Wang, Y. Cai. Partially coherent light beam shaping via complex spatial coherence structure engineering. Adv. Phys., 7, 2009742(2022).

    [37] X. Lu, Z. Wang, C. Zhao. Four-dimensional experimental characterization of partially coherent light using incoherent modal decomposition. Nanophotonics, 12, 3463-3470(2023).

    [38] A. Rana, J. Zhang, M. Pham. Potential of attosecond coherent diffractive imaging. Phys. Rev. Lett., 125, 086101(2020).

    [39] I. Nape, K. Singh, A. Klug. Revealing the invariance of vectorial structured light in complex media. Nat. Photonics, 16, 538-546(2022).

    [40] A. Klug, C. Peters, A. Forbes. Robust structured light in atmospheric turbulence. Adv. Photon., 5, 016006(2023).

    [41] Y. Liu, Y. Chen, F. Wang. Robust far-field imaging by spatial coherence engineering. Opto-Electron. Adv., 4, 210027(2021).

    Zhuoyi Wang, Xingyuan Lu, Jianbo Gao, Xuechun Zhao, Qiwen Zhan, Yangjian Cai, Chengliang Zhao. Coherence phase spectrum analyzer for a randomly fluctuated fractional vortex beam[J]. Photonics Research, 2024, 12(1): 33
    Download Citation