
Ping WANG, Xinyu LI, Zhanling SHI, Haitao LI. Synergistic Effect of Ag and Ag2O on Photocatalytic H2-evolution Performance of TiO2 [J]. Journal of Inorganic Materials, 2020, 35(7): 781
- Journal of Inorganic Materials
- Vol. 35, Issue 7, 781 (2020)
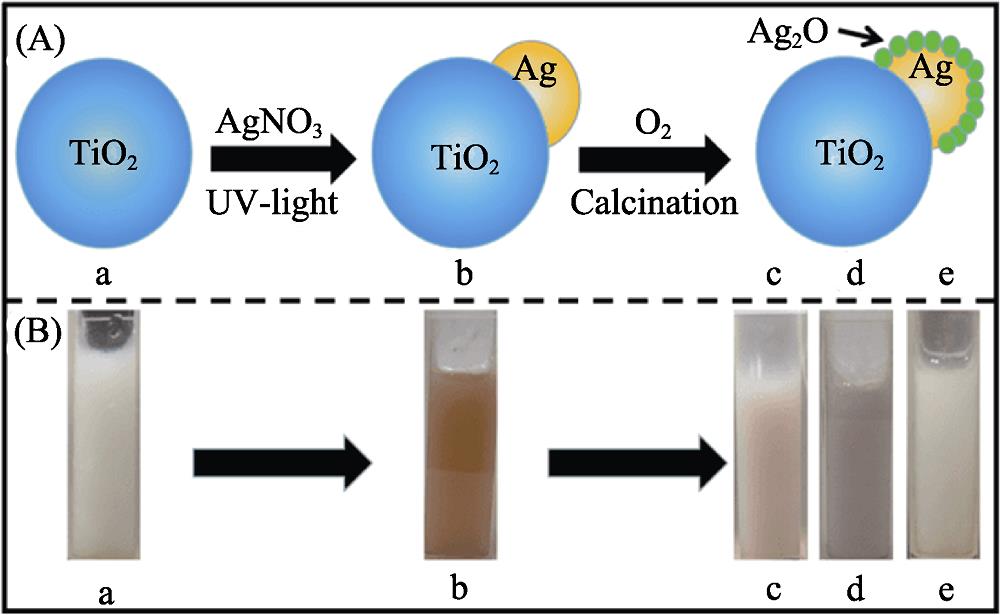
1. (A) Schematic diagram of preparation for TiO2/Ag-Ag2O and (B) their corresponding photographs
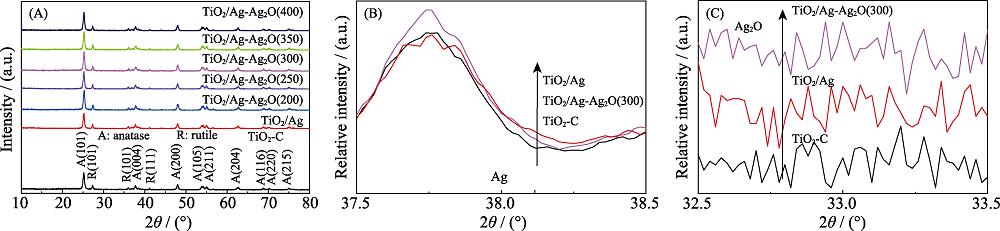
2. (A) XRD patterns, (B) diffraction peaks of metallic Ag and (C) diffraction peaks of Ag2O for TiO2-C, TiO2/Ag and TiO2/Ag-Ag2O(x )
3. (A-F) FESEM images of TiO2-C, TiO2/Ag and TiO2/Ag-Ag2O(x )with insets showing their corresponding EDS spectra and data, and TEM images of TiO2/Ag-Ag2O(300) at low (G) and high (H) magnifications
4. (A) XPS survey spectra and (B) the high-resolution XPS spectra of Ag3d spectra of TiO2-C, TiO2/Ag and TiO2/Ag-Ag2O(x ), and typical fitting curves of (C)Ag3d and (D)O1s for TiO2/Ag-Ag2O(300)
5. UV-Vis absorption spectra of TiO2-C, TiO2/Ag and TiO2/Ag-Ag2O(x ) and their corresponding photographs (inset)
6. (A) Photocatalytic H2-evolution activity of TiO2-C, TiO2/Ag and TiO2/Ag-Ag2O(x ), and (B) cycling performance of TiO2/Ag-Ag2O(300)
7. Schematic diagram of photocatalytic H2-evolution mechanism of TiO2/Ag-Ag2O
8. (A) Linear sweep voltammetry (LSV) curves, (B) transient photocurrent responses, and (C) electrochemical impedance spectra (EIS) of TiO2-C, TiO2/Ag and TiO2/Ag-Ag2O(x )
9. Photoluminescence (PL) spectra of TiO2-C, TiO2/Ag and TiO2/Ag-Ag2O(x )
|
Table 1. Contents of elements in various samples according to XPS analysis

Set citation alerts for the article
Please enter your email address
© Copyright 2018-2021 | Chinese Laser Press. All Rights Reserved 沪ICP备15018463号-20