• Laser & Optoelectronics Progress
  • Vol. 61, Issue 9, 0914005 (2024)
Jiaqi Zhao, Tingting Zhang, Tianjun Zhang, Wenjie Wang*, and Shaoding Liu
Author Affiliations
  • Key Laboratory of Advanced Transducers and Intelligent Control System of Education, Taiyuan University of Technology, Taiyuan 030024, Shanxi , China
  • show less
    DOI: 10.3788/LOP231079 Cite this Article Set citation alerts
    Jiaqi Zhao, Tingting Zhang, Tianjun Zhang, Wenjie Wang, Shaoding Liu. Polarization Characterization of Fluorescence Resonance Energy Transfer Optofluidic Lasers[J]. Laser & Optoelectronics Progress, 2024, 61(9): 0914005 Copy Citation Text show less
    Experimental setup and materials. (a) Single-stranded DNA; (b) G-Quadruplex DNA; (c) diagram of the experimental setup
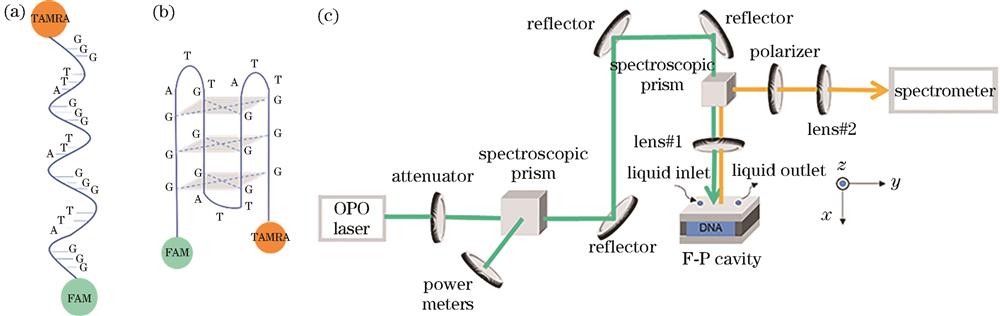
    Fig. 1. Experimental setup and materials. (a) Single-stranded DNA; (b) G-Quadruplex DNA; (c) diagram of the experimental setup
    Spectral graphs. (a) Spectral graph of the receptor laser in parallel polarization direction at 0 μmol/L K+; (b) spectral graph of the receptor laser in vertical polarization direction at 0 μmol/L K+; (c) spectral graph of the receptor laser in parallel polarization direction at 10 μmol/L K+; (d) spectral graph of the receptor laser in vertical polarization direction at 10 μmol/L K+
    Fig. 2. Spectral graphs. (a) Spectral graph of the receptor laser in parallel polarization direction at 0 μmol/L K+; (b) spectral graph of the receptor laser in vertical polarization direction at 0 μmol/L K+; (c) spectral graph of the receptor laser in parallel polarization direction at 10 μmol/L K+; (d) spectral graph of the receptor laser in vertical polarization direction at 10 μmol/L K+
    Laser pumping threshold curves of TAMRA receptors in parallel and vertical polarization directions for different K+ concentrations at DNA molecule concentration 50 μmol/L. (a) 0 μmol/L; (b) 5 μmol/L; (c) 10 μmol/L; (d) 20 μmol/L;(e) 50 μmol/L
    Fig. 3. Laser pumping threshold curves of TAMRA receptors in parallel and vertical polarization directions for different K+ concentrations at DNA molecule concentration 50 μmol/L. (a) 0 μmol/L; (b) 5 μmol/L; (c) 10 μmol/L; (d) 20 μmol/L;(e) 50 μmol/L
    Scatter plot of RSER values of acceptor with potassium ion concentration
    Fig. 4. Scatter plot of RSER values of acceptor with potassium ion concentration
    IngredientConcentrationpH
    Tris-HCl buffer0.1 mol/L8.04
    DNA molecule solution50 μmol/L
    KCl solution0, 5, 10, 20, 50 μmol/L
    LiCl solution100, 95, 90, 80, 50 μmol/L
    Table 1. Specific parameters of the configured G-quadruplex solution
    c(K+) /(μmol/L)Slope of the threshold curve /(mm2·μJ-1Threshold /(μJ·mm-2
    Parallel polarizationVertical polarizationParallel polarizationVertical polarization
    098.474.88356.52715.84
    5153.4112.77114.1971.93
    10315.5954.4180.6665.30
    201022.50524.4716.4114.67
    50869.69565.5410.8211.52
    Table 2. Curve slopes and laser thresholds in the parallel and perpendicular directions for acceptor lasers with different concentration of K+ in the solvent
    Jiaqi Zhao, Tingting Zhang, Tianjun Zhang, Wenjie Wang, Shaoding Liu. Polarization Characterization of Fluorescence Resonance Energy Transfer Optofluidic Lasers[J]. Laser & Optoelectronics Progress, 2024, 61(9): 0914005
    Download Citation