• Photonics Research
  • Vol. 12, Issue 4, 682 (2024)
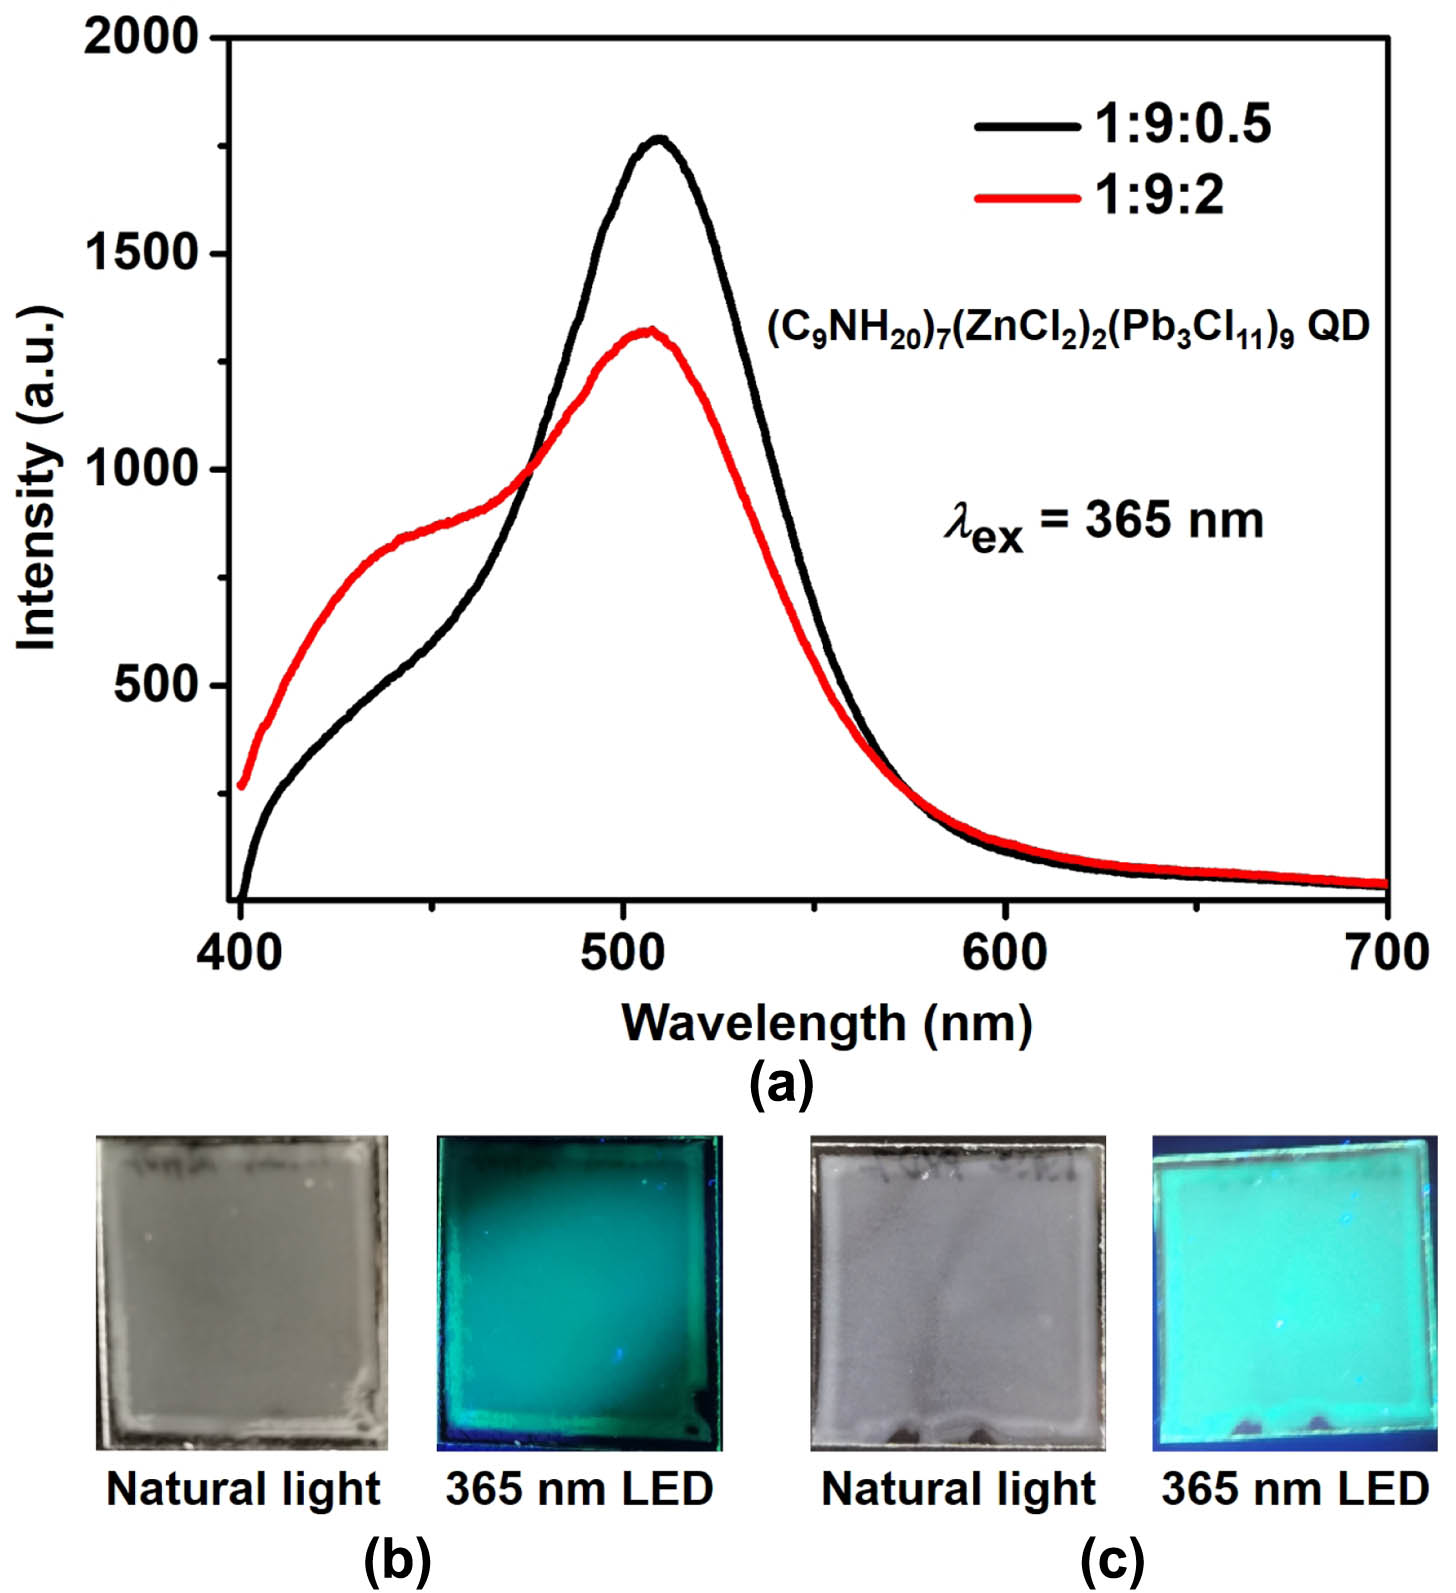
Wanxin Shi1、2、†, Xi Jiang3、†, Zheng Huang1, Xue Li3, Yuyang Han1, Sigang Yang1, Haizheng Zhong3, and Hongwei Chen1、*
Author Affiliations
  • 1Beijing National Research Center for Information Science and Technology (BNRist), Department of Electronic Engineering, Tsinghua University, Beijing 100084, China
  • 2China Mobile Research Institute, Beijing 100053, China
  • 3MIIT Key Laboratory for Low-dimensional Quantum Structure and Devices, School of Materials Sciences & Engineering, Beijing Institute of Technology, Beijing 100081, China
  • show less
    DOI: 10.1364/PRJ.515349 Cite this Article Set citation alerts
    Wanxin Shi, Xi Jiang, Zheng Huang, Xue Li, Yuyang Han, Sigang Yang, Haizheng Zhong, Hongwei Chen. Lensless opto-electronic neural network with quantum dot nonlinear activation[J]. Photonics Research, 2024, 12(4): 682 Copy Citation Text show less
    Photoluminescence of (C9NH20)7(ZnCl2)2(Pb3Cl11)9 QD film. (a) Photoluminescence emission spectra. 1:9:2 and 1:9:0.5 are the molar ratios of perovskite quantum dot components. (b), (c) Comparison of 1:9:2 (b) and 1:9:0.5 (c) quantum dot films under sunlight and UV light irradiation.
    Fig. 1. Photoluminescence of (C9NH20)7(ZnCl2)2(Pb3Cl11)9 QD film. (a) Photoluminescence emission spectra. 1:9:2 and 1:9:0.5 are the molar ratios of perovskite quantum dot components. (b), (c) Comparison of 1:9:2 (b) and 1:9:0.5 (c) quantum dot films under sunlight and UV light irradiation.
    Fitting nonlinear curves of quantum dots with different component molar ratios. (a) 1:9:2. (b) 1:9:0.5.
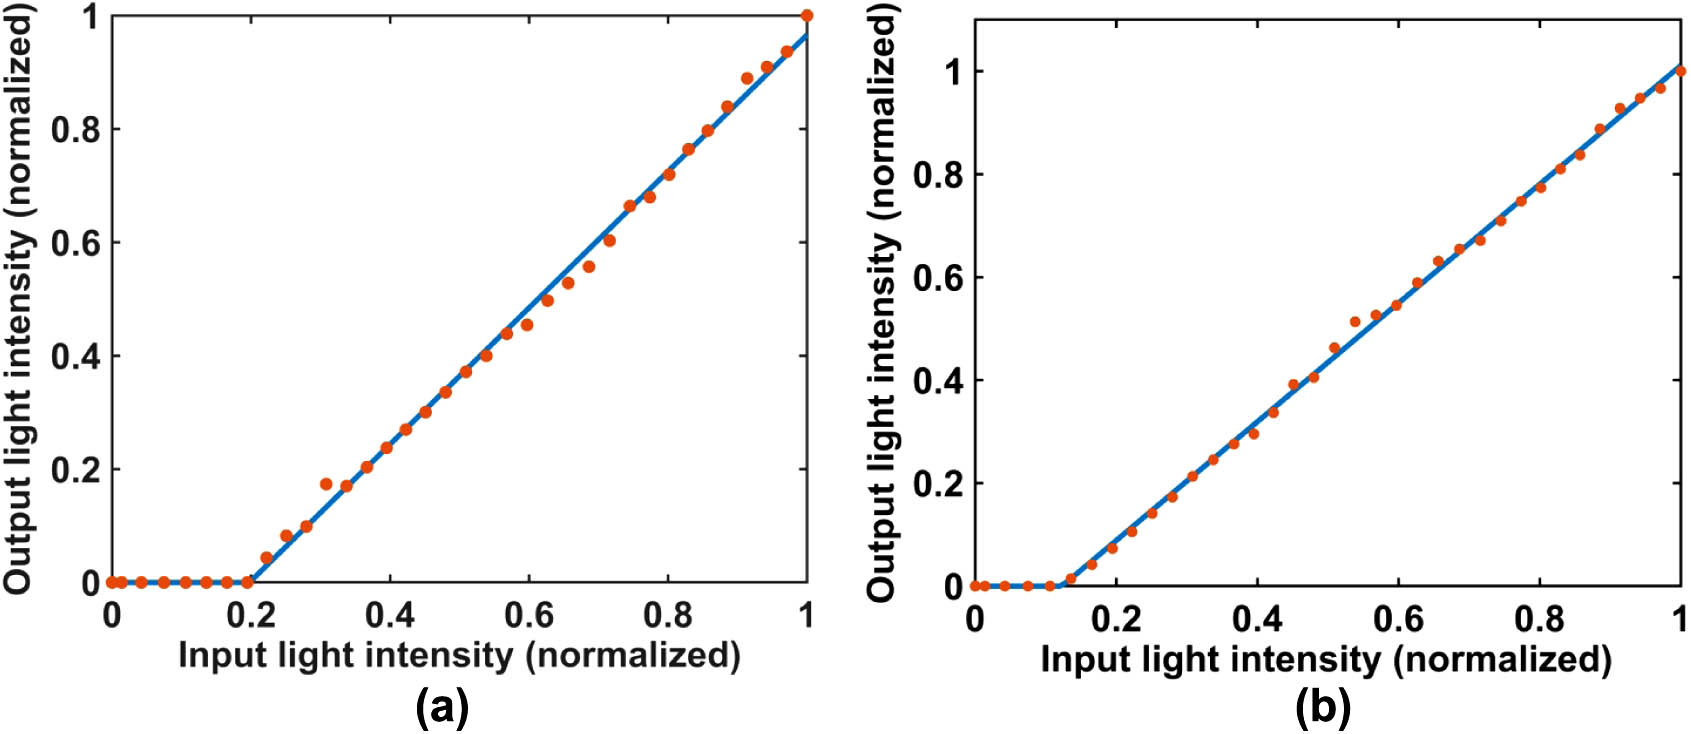
    Fig. 2. Fitting nonlinear curves of quantum dots with different component molar ratios. (a) 1:9:2. (b) 1:9:0.5.
    Prototype for the lensless opto-electrical neural network system with optical nonlinearity. (a) Optical path diagram of the system. (b) Corresponding network structure diagram of the system.
    Fig. 3. Prototype for the lensless opto-electrical neural network system with optical nonlinearity. (a) Optical path diagram of the system. (b) Corresponding network structure diagram of the system.
    Joint optimization process based on quantum dot nonlinearity.
    Fig. 4. Joint optimization process based on quantum dot nonlinearity.
    Visual tasks and the corresponding networks used in the experiment. Among them, the left side of (a)–(c) is part of the visual task dataset, the middle is the optical mask pattern optimized for the corresponding task, and the right side is the neural network architecture of the corresponding visual task. (a) Hand sign classification. (b) Hand drawn image classification. (c) Traffic sign classification.
    Fig. 5. Visual tasks and the corresponding networks used in the experiment. Among them, the left side of (a)–(c) is part of the visual task dataset, the middle is the optical mask pattern optimized for the corresponding task, and the right side is the neural network architecture of the corresponding visual task. (a) Hand sign classification. (b) Hand drawn image classification. (c) Traffic sign classification.
    Captured images. (a) Captured images of three visual tasks, which were rendered from raw data. (b) Comparison of images between linear and nonlinear systems. “Linear_exp” refers to the images captured in the linear system experiment, “Nonliear_sim” refers to the result of adding the measured QD nonlinearity to the images captured in the linear system experiment, and “Nonlinear_exp” refers to the images captured in the nonlinear system experiment. The red box in the figure is the enlarged part; the enlarged image is in the bottom-right corner. The “comparison” figures on the right side represent the comparisons of pixel values at the yellow line position of the corresponding three images.
    Fig. 6. Captured images. (a) Captured images of three visual tasks, which were rendered from raw data. (b) Comparison of images between linear and nonlinear systems. “Linear_exp” refers to the images captured in the linear system experiment, “Nonliear_sim” refers to the result of adding the measured QD nonlinearity to the images captured in the linear system experiment, and “Nonlinear_exp” refers to the images captured in the nonlinear system experiment. The red box in the figure is the enlarged part; the enlarged image is in the bottom-right corner. The “comparison” figures on the right side represent the comparisons of pixel values at the yellow line position of the corresponding three images.
    Results for optical nonlinear system. (a) Experimental recognition accuracy of hand sign, hand drawn image, and traffic sign classification tasks. (b) Confusion matrices of the three visual tasks based on experimental raw data. The abscissa is “predicted labels,” and the ordinate is “true labels.”
    Fig. 7. Results for optical nonlinear system. (a) Experimental recognition accuracy of hand sign, hand drawn image, and traffic sign classification tasks. (b) Confusion matrices of the three visual tasks based on experimental raw data. The abscissa is “predicted labels,” and the ordinate is “true labels.”
    Wanxin Shi, Xi Jiang, Zheng Huang, Xue Li, Yuyang Han, Sigang Yang, Haizheng Zhong, Hongwei Chen. Lensless opto-electronic neural network with quantum dot nonlinear activation[J]. Photonics Research, 2024, 12(4): 682
    Download Citation