 AI Video Guide
  AI Picture Guide
 AI One Sentence

Wanxin Shi, Xi Jiang, Zheng Huang, Xue Li, Yuyang Han, Sigang Yang, Haizheng Zhong, Hongwei Chen, "Lensless opto-electronic neural network with quantum dot nonlinear activation," Photonics Res. 12, 682 (2024)
- Photonics Research
- Vol. 12, Issue 4, 682 (2024)
Note: This section is automatically generated by AI . The website and platform operators shall not be liable for any commercial or legal consequences arising from your use of AI generated content on this website. Please be aware of this.
Abstract
1. INTRODUCTION
Over the past decade, deep learning anchored in neural networks [1] has ushered in transformative changes across a myriad of fields, including computational imaging [2,3], autonomous driving [4], natural language processing [5], and numerous other intelligent applications [6–8]. However, the escalating demand for even faster and more energy-efficient systems has imposed constraints on the further development of electrical neural networks. In response to this challenge, researchers have turned to the realm of optical neural networks (ONNs) [9–13], harnessing their exceptional computing speed, massive parallelism, and low latency as promising alternative solutions. Considering compatibility with existing machine vision systems, such as the applications in practical natural scenarios, the emergence of hybrid opto-electric neural networks (OENNs) [14–16] also offers a potential avenue.
In most ONNs and OENNs, optics only completes linear operations, while the nonlinear activation is implemented electronically. This creates a significant barrier to implementing spatial nonlinear activation functions—a small but essential component of ONNs. Recently, some all-optical multilayer neural network schemes have been proposed to increase the accuracy of tasks. Ideally, when there is no nonlinearity between network layers, multilayer operations could be equivalent to single-layer matrix calculations. Correspondingly, experimental data indicates that an all-optical multilayer neural network, which lacks optical nonlinearity between layers, exhibits limited enhancements in task accuracy. Thus, its applicability in other visual task scenarios is also limited.
In the pursuit of advancing optical neural networks, researchers have been exploring methods to achieve optical nonlinear activation functions with modulations. Previous research has demonstrated various approaches to realizing such nonlinearities, including the utilization of electro-optic modulators such as Mach–Zehnder interferometers (MZIs) or microrings [17,18]. Moreover, some strategies have been proposed to achieve optical nonlinear activation functions in all-optical neural networks with the aim of mitigating energy loss during photoelectric conversion. Among them, optical nonlinearity can be categorized into one-dimensional (1D) and two-dimensional (2D) spatial nonlinearity. The 1D nonlinearities refer to the realization of optical single-point nonlinear activation through specific materials or systems. At present, phase change materials (PCMs) [19] and saturable absorbers (SAs) [20,21] are commonly used to realize nonlinearity. PCMs exhibit two states—amorphous and crystalline—with high transmittance in the amorphous state and low transmittance in the crystalline state. In spiking neurosynaptic networks, when the input light intensity surpasses a certain threshold, PCMs change state and generate output pulses, effectively emulating the behavior of the ReLU function. Similarly, SAs are often integrated into lasers to facilitate nonlinear modulation. As the light intensity increases, the SA progressively reaches a saturated state, eventually transmitting light completely. Likewise, other materials such as periodically poled thin-film lithium niobate nanophotonic waveguides [22,23] and germanium silicon hybrid asymmetric couplers [24], can also implement optical point-to-point nonlinear activation. These aforementioned methods generally necessitate a coherent light source, which makes them difficult to use in natural scenes.
Sign up for Photonics Research TOC. Get the latest issue of Photonics Research delivered right to you!Sign up now
Similar to 1D nonlinearity, each point in two-dimensional space has the same nonlinear modulation function in 2D nonlinearity. Two-dimensional graphene [25] materials have garnered considerable attention as a potential means of achieving optical nonlinearity. Graphene exhibits unique characteristics, such as low threshold, easy excitation, and strong nonlinear effects. When the light intensity exceeds the threshold, the transmittance varies with the input power, representing a nonlinear process. Besides, Ryou
In recent years, significant progress has been made in developing optical domain nonlinear methods. However, it is evident that fulfilling the requirements of passive low energy consumption, natural light operation, spatial two-dimensional nonlinearity, and a simple, miniaturized system concurrently remains a formidable challenge. In this paper, we demonstrate a lensless opto-electronic neural network with quantum dot (QD) nonlinear activation for visual tasks in natural scenes. Remarkably, the system does not need an additional power supply, while the convolution and nonlinear activation operations are realized only by an optical mask and QD film. This approach not only simplifies the system’s architecture but also enhances its compactness and energy efficiency. The introduction of optical nonlinearity into our opto-electronic neural network plays a role in improving the accuracy of the corresponding visual tasks.
2. NONLINEAR OPTICAL ACTIVATION FUNCTION
Quantum dots are semiconductor nanocrystals, typically measuring between 2 and 10 nm in size. During the photoluminescence process of quantum dots, external photons excite the electrons in the quantum dots. The electrons can directly jump to the valence band and then recombine with holes to emit light. Alternatively, electrons might first form excitons by combining with holes and then transition to the ground state, resulting in radiative luminescence. During this process, defects, impurities, and lattice thermal vibrations will increase nonradiative recombination and reduce luminous efficiency.
The nonlinear optical properties of perovskite materials are generally reflected in phenomena such as saturation absorption and two-photon (multi-photon) absorption [32,33]. They have a variety of forms, including single crystals, polycrystalline films, quantum dots, etc. This article proposes a nonlinear optical system based on perovskite quantum dots, in which the relationship between excitation power and quantum dot luminescence intensity is similar to the ReLU function. When the excitation power surpasses a certain value, the detector begins to respond to the luminous intensity of the material. After that, as the excitation power increases, the quantum dot photoluminescent light intensity increases correspondingly.
The excitons formed after material excitation have exciton binding energies close to room temperature thermal energy, and they are easily dissociated into free carriers. Since the electron–hole recombination rate of perovskite is slow, the excited carriers may first be captured by nonradiative recombination centers. Meanwhile, as the excitation power increases, the carrier density is higher, and radiative recombination becomes dominant. In carrier recombination dynamics, the quantum efficiency gradually increases to saturation as the excitation light intensity increases, and the increase process may correspond to a change in excitation intensity of 2–3 orders of magnitude [34]. Limited by the luminous intensity of the material and the sensitivity of the photodetectors, the detectors cannot respond to luminescence when the excitation power is low. The above reasons may jointly lead to the nonlinear process of quantum dot luminescence.
3. MEASUREMENT OF NONLINEAR ACTIVATION CURVE
The quantum dots material we use in the experiment is
The quantum dot luminescence spectrum is shown in Fig. 1. In order to distinguish the excitation light and emitted light, the wavelength of excitation light is set as 365 nm. Meanwhile, in the experiment, the center wavelength of excitation light is 405 nm, and the perovskite quantum dots emit green light with a center wavelength of 512 nm.
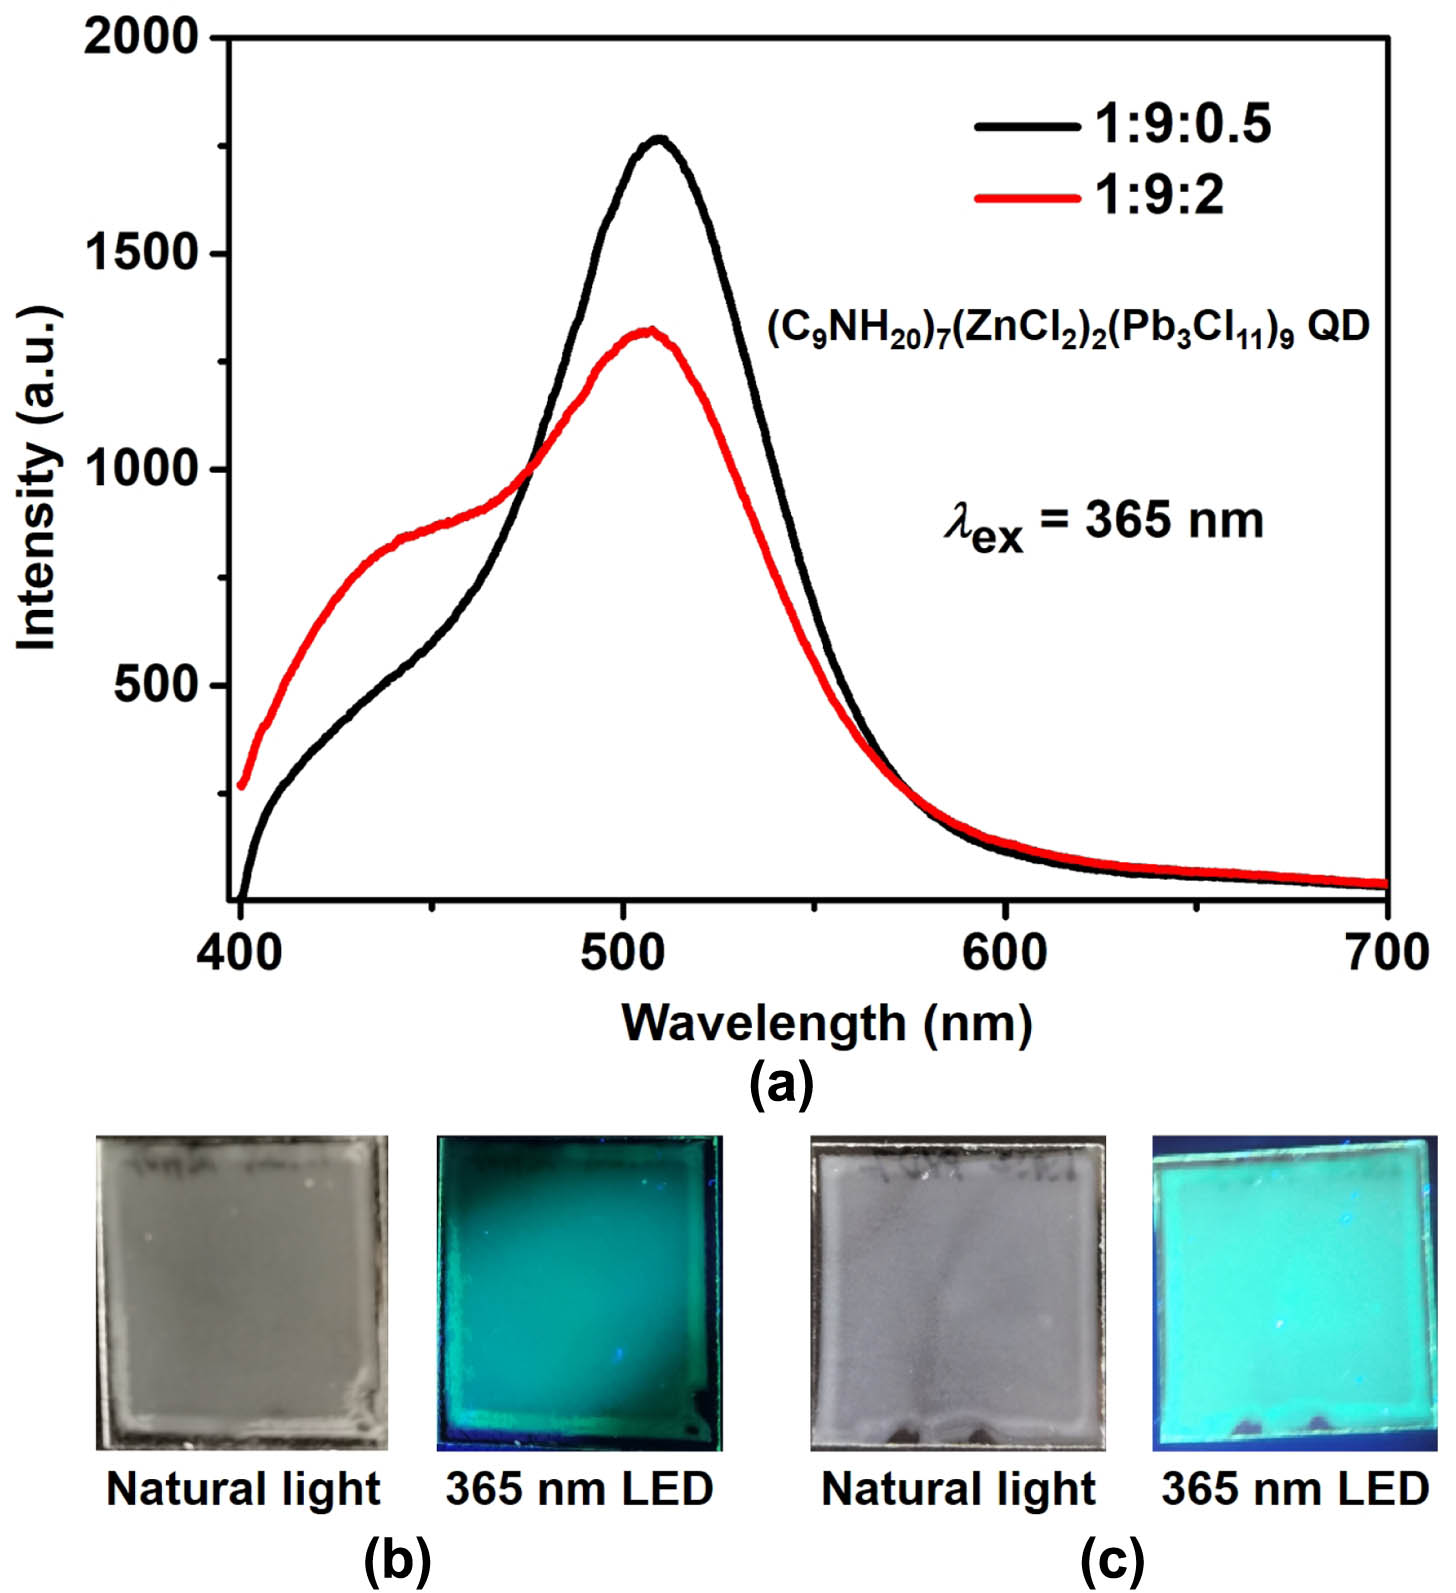
Figure 1.Photoluminescence of
In the experiment, we use an LED array with 405 nm center wavelength to measure the nonlinear curve and project images of visual tasks. The pixel size of the array is
The activation curves of the quantum dots are shown in Fig. 2, formulated with component molar ratio of
![]()
Figure 2.Fitting nonlinear curves of quantum dots with different component molar ratios. (a) 1:9:2. (b) 1:9:0.5.
4. JOINT OPTIMZATION OF THE OPTO-ELECTRONIC NEURAL NETWORK WITH QUANTUM DOT NONLINEARITY
In electrical neural networks, nonlinear activation functions can make the network more powerful. Beyond accelerating convergence and improving task accuracy, they augment the network’s capacity to learn intricate data and represent sophisticated nonlinear mappings between inputs and outputs. As such, nonlinear activation functions play a crucial and indispensable role in neural networks.
The opto-electronic neural network architecture based on quantum dot nonlinearity is shown in Fig. 3. In our previous research, we introduced the concept of the feature size
![]()
Figure 3.Prototype for the lensless opto-electrical neural network system with optical nonlinearity. (a) Optical path diagram of the system. (b) Corresponding network structure diagram of the system.
The joint optimization process of the whole system link is shown in Fig. 4. The entire link consists of four components: the optical mask, which completes the convolution calculation, the quantum dots utilized for nonlinear activation, the sensor capturing the feature map following convolution and nonlinear calculation, and a digital processor executing subsequent electrical network operations. In pursuit of maximizing the overall network classification accuracy, the whole link is optimized in an end-to-end fashion. The nonlinear activation curve is used to be a fixed nonlinear activation module between the optical convolution part and the electrical neural network (suffix network). Subsequently, the loss function is calculated based on the captured nonlinearly activated feature map. All network parameters, except the nonlinear layer parameters, are simultaneously optimized through the loss function in the joint optimization process. Finally, the optical convolution kernel pattern is obtained.
![]()
Figure 4.Joint optimization process based on quantum dot nonlinearity.
5. LENSLESS OPTO-ELECTRONIC NEURAL NETWORK WITH NONLINEARITY FOR APPLICATION
A. Machine Learning Visual Tasks
In this section, we numerically characterized the performance of the quantum dot nonlinearity on the visual tasks. We first chose the classification of the hand-drawn images. To this end, we opted for 10 classes from the QuickDraw image dataset. As illustrated in Fig. 5(b), the input image, sized at
![]()
Figure 5.Visual tasks and the corresponding networks used in the experiment. Among them, the left side of (a)–(c) is part of the visual task dataset, the middle is the optical mask pattern optimized for the corresponding task, and the right side is the neural network architecture of the corresponding visual task. (a) Hand sign classification. (b) Hand drawn image classification. (c) Traffic sign classification.
In addition to the hand-drawn image classification, we also conducted experiments for two other visual tasks: hand sign and traffic sign classification, as depicted in Fig. 5. Unlike the previous task, these images are grayscale representations captured from actual scenes, making their classification more challenging. As for the hand sign classification task in Fig. 5(a), the pixel size of the images was reshaped to
B. Nonlinear Activation Opto-Electrical Neural Network Experiment
As shown in the system prototype in Fig. 3, the images were displayed on the LED array, situated 10–20 cm from the optical mask. The QD film was positioned close to the mask, maintaining a minute separation of approximately 1 mm. The sensor was also positioned about 1 mm from the QD film. Inspired by our previous work, the image signal processing (ISP) process includes many links such as demosaic, white balance, color correction, and tone mapping. However, only a few parameters can be adjusted in the process, and these processes are primarily optimized for human perception rather than task-oriented optimization. So it can be concluded that the ISP process of the sensor is not necessary for the whole pipeline. Therefore, we directly collected raw data without any demosaic processing, using the G channel of the raw data for subsequent analysis. A few images were rendered for human comprehension, as depicted in Fig. 6(a). We qualitatively compared the rendered images before and after adding nonlinearity from raw data. It can be seen in Fig. 6(b), when adding QD optical nonlinearity, the relative intensity of the original high light intensity part in the image does not change much, while the gray value of the original low intensity part decreases significantly. The phenomenon above is consistent with the measured nonlinear curve of QD in Fig. 2. As for quantitative comparison in Fig. 6(b), although the overall trend remained consistent, there existed a certain discrepancy between the image produced by directly adding the measured nonlinearity and the image obtained from the nonlinear system. For example, the “Nonlinear_exp” images measured have higher peak widths than the “Nonlinear_sim” images, and the trough values do not drop to 0. This discrepancy can be attributed to the noise of the imaging sensor, the blur caused by the quantum dot scattering process, system correction error, and minute variations in nonlinearity across different positions.
![]()
Figure 6.Captured images. (a) Captured images of three visual tasks, which were rendered from raw data. (b) Comparison of images between linear and nonlinear systems. “Linear_exp” refers to the images captured in the linear system experiment, “Nonliear_sim” refers to the result of adding the measured QD nonlinearity to the images captured in the linear system experiment, and “Nonlinear_exp” refers to the images captured in the nonlinear system experiment. The red box in the figure is the enlarged part; the enlarged image is in the bottom-right corner. The “comparison” figures on the right side represent the comparisons of pixel values at the yellow line position of the corresponding three images.
The image classification results of the opto-electrical neural network with nonlinear activation are presented in Fig. 7. Throughout the simulation of three visual tasks, the incorporation of the quantum dot nonlinear layer led to an average increase in classification accuracy by 4.43%. Both the linear and nonlinear networks utilized a joint optimization strategy to enhance task accuracy. In our previous work [35], we demonstrated LOEN architecture, which can complete optical convolution and some image classification tasks. Comparatively, the classification accuracy achieved in the single-kernel optical convolution experiment was slightly lower than the simulation, with an average difference of 2%. Therefore, the linear system experiment was not repeated in this paper, and we directly referred to the simulation data and the conclusion of the accuracy difference between the simulation and experiment in LOEN [35].
![]()
Figure 7.Results for optical nonlinear system. (a) Experimental recognition accuracy of hand sign, hand drawn image, and traffic sign classification tasks. (b) Confusion matrices of the three visual tasks based on experimental raw data. The abscissa is “predicted labels,” and the ordinate is “true labels.”
In the subsequent phase, we utilized the optical mask optimized by the entire neural network to construct the system and conduct the nonlinear experiments. The results of the experiment are shown in Fig. 7. The classification accuracy of hand sign, hand drawn images, and traffic sign tasks can reach 86.6%, 78.6%, and 84.74%, respectively, representing improvements of 2.16%, 3.75%, and 5.88% over the corresponding linear system simulation accuracy. If the gap between linear system simulation and experiment is taken into consideration, the accuracy improvement of the nonlinear system will be higher.
The confusion matrices corresponding to the task classification results are shown in Fig. 7(b). It can be seen from the results that the addition of the QD nonlinear layer effectively improves the classification accuracy of each category. The average accuracy difference between the nonlinear experiments and simulations for the three visual tasks was measured at 1.46%, similar to the average difference observed between the linear system simulations and experiments. Several factors may contribute to this discrepancy. First, the inhomogeneity of the quantum dot film can yield disparities in the nonlinear activation functions of neurons at different positions within the network. Second, the quantum dot scattering process is relatively complex, potentially leading to a certain degree of blurring effect on the results of optical convolution, thereby influencing the accuracy of visual tasks.
6. DISCUSSION
In this study, we demonstrated a novel nonlinear opto-electrical neural network capable of efficiently handling various visual tasks. Unlike traditional approaches that rely solely on electrical processors for nonlinear activation, our architecture utilized the quantum dot film to achieve nonlinear activation directly on the feature map. Meanwhile, the convolution operation is efficiently performed by the optical mask. Compared to the other optical neural networks with optical nonlinearity, the method allows us to achieve passive spatial nonlinear activation, eliminating the need for additional electrical calculations and maintaining a lensless system. As a result, the overall size and energy consumption of the system are significantly reduced.
Similar to our previous work, the entire pipeline is simplified without imaging and activation, and the whole architecture, including the optical and electrical parts, is task-oriented jointly optimized. The joint optimization strategy enhances the overall performance of the opto-electronic neural network, making it more effective in real-world applications. When considering the entire pipeline, it is essential to evaluate the energy demands not only of the subsequent electrical neural network computations but also of the sensor detection phase. This latter segment is predominantly governed by the energy costs of photosensitive detection and the ISP. The two parts have comparable energy cost. Due to the whole pipeline being optimized facing the task accuracy, the ISP process was removed from the experiments, which resulted in a nearly 50% reduction in energy consumption in the sensor detection part.
The exploration in this paper is focused on a specific type of perovskite quantum dot as a nonlinear material. Compared with other optical nonlinear implementation methods, the main advantages of this method are that no additional power supply is required, the system is simple and miniaturized, and the light source is incoherent light, making it suitable for use in low-power edge devices. Future investigations should diversify by evaluating the nonlinear characteristics of other materials to enhance the accuracy of various machine vision tasks. On the other hand, it is necessary to improve the luminous conversion efficiency of quantum dots as much as possible to reduce energy loss and optimize the overall energy efficiency of the opto-electrical neural network. As for the multilayer nonlinearity cascade, it can be realized in the following ways in the future: adding other quantum dot materials [36], adjusting the size of the quantum dot material to change the band gap to further expand the photoluminescence wavelength range [37], and changing the composition ratio of the same quantum dot components to adjust the photoluminescence properties [38]. It is worth noting that because the light intensity is attenuated during transmission and there is no power supply in the system architecture, the system cannot complete light regeneration or light amplification between layers. The above factors will limit the number of cascadable quantum dot nonlinear layers.
The opto-electrical neural network with only one optical convolution layer and one passive optical nonlinear activation layer was demonstrated. Similar to other optical neural networks [39,40], only a single nonlinear layer has limited improvement in the accuracy of visual tasks. However, optical nonlinearity provides ideas and methods for all-optical multilayer neural networks. Efficient all-optical multilayer neural networks are more promising when combined with optical nonlinearity. Apart from the quantum dot films used in the experiment, as long as the device has an optical-to-electrical-to-optical (OEO) or optical-to-optical (O-O) conversion function, it can be used to complete nonlinear modulation and cascade the next layer of the optical network. Considering the attenuation during light transmission, a power supply can be added to achieve light amplification or light regeneration. The power supply can further increase the number of layers of the nonlinear optical neural networks and help them be applied to various complex visual scenes. By expanding the optical nonlinear model, it becomes possible to propose a multilayer opto-electronic neural network with nonlinear activation, paving the way for the realization of an all-optical neural network with interlayer nonlinearity. In the future, we would focus on developing efficient multilayer optical neural networks, leveraging the power of optical nonlinearity to perform complex computations without relying on traditional electrical components. The all-optical neural network can complete specific tasks under natural incoherent light. There is theoretically no power consumption in the architecture, while the system size and weight can be minimized. The architecture is highly attractive for applications in autonomous driving, smart homes, and other real-world scenarios. With reduced energy consumption and compact design, the all-optical neural network can revolutionize various industries, offering a wide range of application scenarios and contributing to developing more energy-efficient and powerful artificial intelligence systems.
7. MATERIALS AND METHODS
A. Preparation of Quantum Dot Film
The
B. Mask Fabrication
The mask is fabricated by photolithography on a chrome-coated glass substrate. This procedure encompasses photolithography, development, etching, and demolding, among other steps. The pattern of the optical mask is fixed while it is obtained by the optimization of the corresponding network. The reasons for choosing the fixed mask are as follows. Primarily, the compact size of the mask ensures a lensless system. Second, the fixed mask has higher contrast compared with the dynamic mask using a spatial light modulator. This not only reduces energy loss in the system but also heightens the accuracy for specific tasks. The detailed discussion has already been made in our previous work [35].
C. Dataset Processing and Neural Network Training
All the images of the experiments are grayscale and resized to match the corresponding network. Converting these images to binary might further enhance the accuracy for specific tasks. The networks are trained and tested on a work-station with a 2-GHz Intel Xeon Gold 6138 central processing unit (CPU) (32 GB RAM) and one Nvidia GeForce RTX 3090 GPU while using the PyTorch framework.
References
[1] Y. LeCun, Y. Bengio, G. Hinton. Deep learning. Nature, 521, 436-444(2015).
[4] M. Al-Qizwini, I. Barjasteh, H. Al-Qassab. Deep learning algorithm for autonomous driving using googlenet. IEEE Intelligent Vehicles Symposium (IV), 89-96(2017).


Set citation alerts for the article
Please enter your email address

© Copyright 2018-2021 | Chinese Laser Press. All Rights Reserved 沪ICP备15018463号-20