• Laser & Optoelectronics Progress
  • Vol. 59, Issue 6, 0617030 (2022)
Ying Ji1、*, Xinyu Wei1, Mingming Zhang2, and Yawei Wang1
Author Affiliations
  • 1School of Physics and Electronic Engineering, Jiangsu University, Zhenjiang , Jiangsu 212013, China
  • 2School of Mechanical Engineering, Jiangsu University, Zhenjiang , Jiangsu 212013, China
  • show less
    DOI: 10.3788/LOP202259.0617030 Cite this Article Set citation alerts
    Ying Ji, Xinyu Wei, Mingming Zhang, Yawei Wang. Experimental Sampling Strategy for Rapid Extraction of Morphological Features Based on Phase Edge Detection[J]. Laser & Optoelectronics Progress, 2022, 59(6): 0617030 Copy Citation Text show less
    Simulation of cellular models. (a) Nucleated cell model; (b) physical thickness of the model at point A along the direction of light incidence; (c) phase distribution of the model
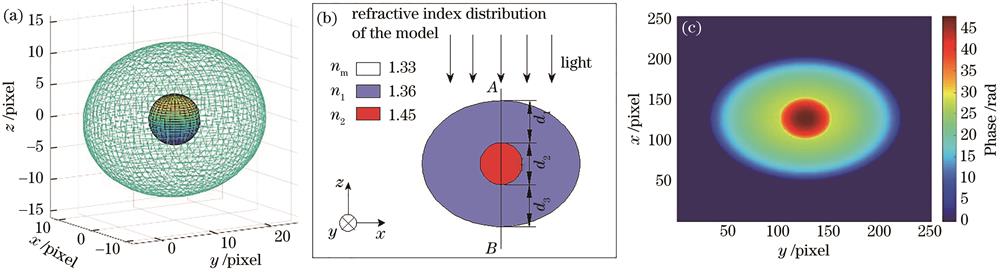
    Fig. 1. Simulation of cellular models. (a) Nucleated cell model; (b) physical thickness of the model at point A along the direction of light incidence; (c) phase distribution of the model
    Gradient data of phase for cellular models. (a) Gradient processing distribution of the cell model phase; (b) gradient distribution curve of the model along the AD direction
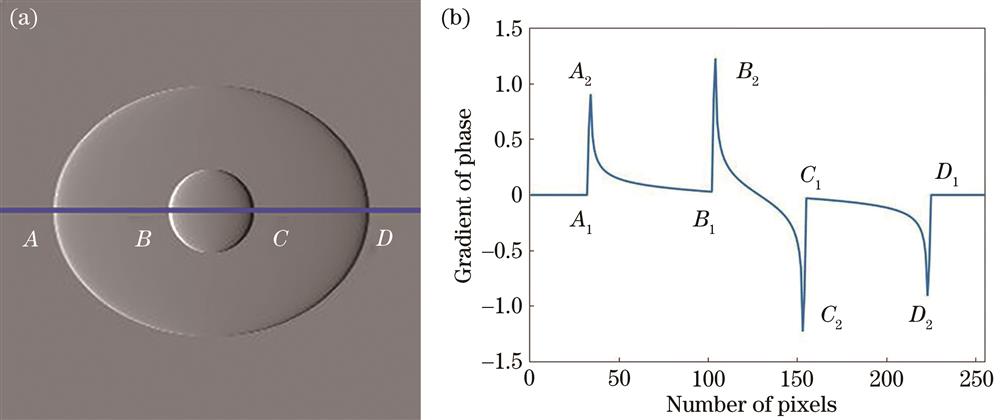
    Fig. 2. Gradient data of phase for cellular models. (a) Gradient processing distribution of the cell model phase; (b) gradient distribution curve of the model along the AD direction
    Processing results of edge detection operator in cell model. (a) ∂2φ/∂x2 distribution of model phase; (b) ∂φ/∂x2 distribution of model phase; (c) Canny distribution of model phase; (d) ∂2φ/∂x2 curve of the model along the AD direction; (e) ∂φ/∂x2 curve of the model along the AD direction; (f) Canny curve of the model along the AD direction
    Fig. 3. Processing results of edge detection operator in cell model. (a) 2φ/x2 distribution of model phase; (b) φ/x2 distribution of model phase; (c) Canny distribution of model phase; (d) 2φ/x2 curve of the model along the AD direction; (e) φ/x2 curve of the model along the AD direction; (f) Canny curve of the model along the AD direction
    Gradient processing results of polystyrene microspheres. (a) Fluorescence imaging of polystyrene fluorescent microspheres; (b) phase distribution of microspheres; (c) phase gradient distribution of microspheres; (d) curve of microsphere gradient distribution in the B1B3 direction; (e) curve of microsphere gradient distribution in the B4B2 direction
    Fig. 4. Gradient processing results of polystyrene microspheres. (a) Fluorescence imaging of polystyrene fluorescent microspheres; (b) phase distribution of microspheres; (c) phase gradient distribution of microspheres; (d) curve of microsphere gradient distribution in the B1B3 direction; (e) curve of microsphere gradient distribution in the B4B2 direction
    Laplacian processing results of polystyrene microspheres. (a) Laplacian processing result of polystyrene microsphere phase; (b) distribution curve of microspheres along the B1B3 direction; (c) distribution curve of microspheres along the B4B2 direction
    Fig. 5. Laplacian processing results of polystyrene microspheres. (a) Laplacian processing result of polystyrene microsphere phase; (b) distribution curve of microspheres along the B1B3 direction; (c) distribution curve of microspheres along the B4B2 direction
    Processing results of the phase of polystyrene microspheres. (a) Processing results of Canny operator for the phase distribution of polystyrene microspheres; (b) processing results of ∂φ/∂x2 operator for the phase distribution of polystyrene microspheres
    Fig. 6. Processing results of the phase of polystyrene microspheres. (a) Processing results of Canny operator for the phase distribution of polystyrene microspheres; (b) processing results of φ/x2 operator for the phase distribution of polystyrene microspheres
    Phase analysis of onion epidermal cells using gradient operator. (a) Fluorescence microscopy of onion epidermal cell; (b) bright field map of onion epidermal cell; (c) phase map of onion epidermal cell; (d) ∂φ/∂x distribution of onion epidermal cell phase; (e) ∂φ/∂x distribution curve of onion epidermal cell along C1C3 direction; (f) ∂φ/∂x distribution curve of onion epidermal cell along C4C2 direction
    Fig. 7. Phase analysis of onion epidermal cells using gradient operator. (a) Fluorescence microscopy of onion epidermal cell; (b) bright field map of onion epidermal cell; (c) phase map of onion epidermal cell; (d) φ/x distribution of onion epidermal cell phase; (e) φ/x distribution curve of onion epidermal cell along C1C3 direction; (f) φ/x distribution curve of onion epidermal cell along C4C2 direction
    Phase analysis of onion epidermal cells using Laplacian operator. (a) ∂2φ/∂x2 distribution of onion epidermal cell phases; (b) ∂2φ/∂x2 distribution curve of cells along the C1C3 direction; (c) ∂2φ/∂x2 distribution curve of cells along the C4C2 direction
    Fig. 8. Phase analysis of onion epidermal cells using Laplacian operator. (a) 2φ/x2 distribution of onion epidermal cell phases; (b) 2φ/x2 distribution curve of cells along the C1C3 direction; (c) 2φ/x2 distribution curve of cells along the C4C2 direction
    Parameter

    A1D1

    (start point)

    A2D2

    (peak point)

    B1C1

    (start point)

    B2C2

    (peak point)

    Pixel coordinate32‒22534‒223102‒155104‒153
    Theoretical value /μm30.0030.008.008.00
    Measured value /μm30.2729.658.317.69
    Absolute error /μm0.27-0.350.31-0.31
    Relative error /%0.901.171.031.03
    Elapsed time /s0.472
    Table 1. Size analysis of sampling under different feature points in the sample model
    Parameter

    B11B31

    (start point)

    B12B32

    (peak point)

    B41B21

    (start point)

    B42B22

    (peak point)

    Pixel coordinate376‒429391‒414207‒260221‒243
    Theoretical value /μm4.2364.2364.2364.236
    Measured value /μm7.8443.4047.8443.256
    Absolute error /μm3.6080.8323.6080.980
    Relative error /%85.1719.6485.1723.14
    Elapsed time /s0.551
    Table 2. Size analysis of polystyrene microspheres at different sampling points under phase gradient distribution
    Parameter

    B11B31

    (start point)

    B12B32

    (peak point)

    B41B21

    (start point)

    B42B22

    (peak point)

    Pixel coordinate387‒418395‒411216‒248224‒239
    Theoretical value /μm4.2364.2364.2364.236
    Measured value /μm4.5882.3684.7362.220
    Absolute error /μm0.352-1.8680.500-2.016
    Relative error /%8.31044.09811.8047.592
    Elapsed time /s0.675
    Table 3. Size analysis of polystyrene microspheres at different sampling points under phase Laplacian processing distribution
    Parameter

    C11C31

    (start point)

    C12C32

    (peak point)

    C41C21

    (start point)

    C42C22

    (peak point)

    Pixel coordinate518‒595537‒580379‒435387‒427
    Theoretical value /μm17.14215.82420.60817.142
    Measured value /μm28.33615.82420.60814.72
    Absolute error /μm11.194-1.3183.466-2.422
    Relative error /%65.3027.68920.18914.129
    Elapsed time /s0.614
    Table 4. Size analysis of onion epidermal cell nucleus under phase gradient treatment
    Parameter

    C11C31

    (start point)

    C12C32

    (peak point)

    C41C21

    (start point)

    C42C22

    (peak point)

    Pixel coordinate535‒582538‒576383‒429389‒425
    Theoretical value /μm17.14217.14217.14217.142
    Measured value /μm17.29613.98416.92813.248
    Absolute error /μm0.154-3.158-0.214-3.894
    Relative error /%0.89818.4231.24822.716
    Elapsed time /s0.733
    Table 5. Size analysis of onion epidermal cell nucleus under 2φ/x2 phase treatment
    Ying Ji, Xinyu Wei, Mingming Zhang, Yawei Wang. Experimental Sampling Strategy for Rapid Extraction of Morphological Features Based on Phase Edge Detection[J]. Laser & Optoelectronics Progress, 2022, 59(6): 0617030
    Download Citation