
Hiroki Morita, Tadashi Ogitsu, Frank R. Graziani, Shinsuke Fujioka. Advanced analysis of laser-driven pulsed magnetic diffusion based on quantum molecular dynamics simulation[J]. Matter and Radiation at Extremes, 2021, 6(6): 065901
- Matter and Radiation at Extremes
- Vol. 6, Issue 6, 065901 (2021)
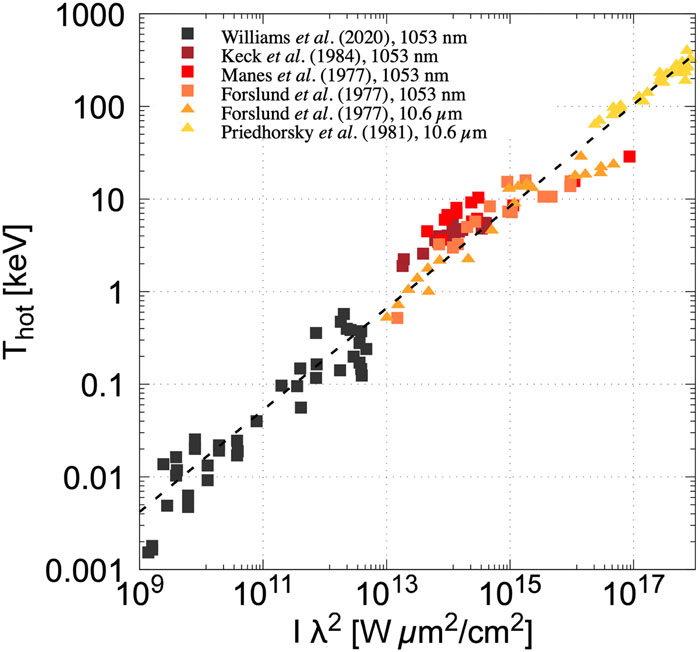
Fig. 1. Laser intensity scaling of hot-electron temperature.26–30 Squares (■) and triangles (▴) represent laser wavelengths of 1053 nm and 10.6 µ m, respectively.
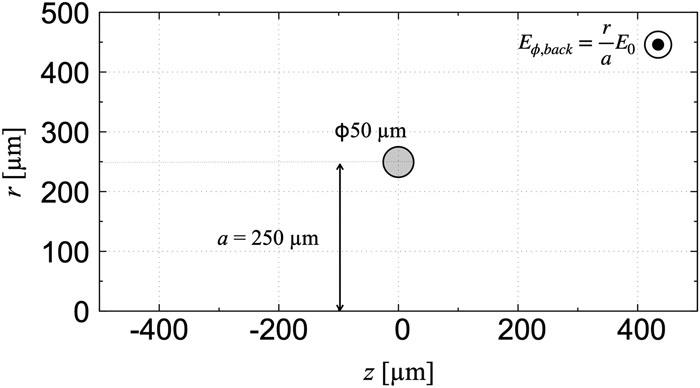
Fig. 2. Calculation geometry and initial condition of the cylindrical simulation. The ring-shaped coil (nickel) was modeled with a coil radius of 250 µ m and a wire diameter of 50 µ m. The background field, E ϕ ,back, was initially imposed.
Fig. 3. Temporal evolution of (a) self-consistent voltage and current and (b) coil resistance. The coil current increases slowly, reaching a maximum at 4.2 ns. The coil resistance changes dramatically until 4.2 ns.
Fig. 4. Temperature dependence of the electrical conductivity of solid dense gold. For T < 0.27 eV, experimental data were used. For 0.27 eV < T < 7 eV, the conductivity was calculated using the Kubo–Greenwood formula based on a quantum MD simulation. For T > 7 eV, the conductivity was calculated with the modified Spitzer formula.
Fig. 5. Temporal evolution of the incident laser pulse (dashed black line), the magnetic field generated in vacuum (solid blue line), and the magnetic field that penetrated the gold cone with a previously reported σ (T )19 (solid green line) and the σ (T ) shown in Fig. 4 (solid red line), respectively. The square point shows the experimental data on the magnetic field measured inside a plastic insulator (corresponding to vacuum).25 The shaded area (4.8–5.2 ns) represents the time window in the arrival times of several shots of a short-pulse laser to heat the fuel core in the previous MFI experiment.15
Fig. 6. Spatial distributions of (a) temperature and (b) magnetic field at 5.2 ns. The cone wall heats up to several tens of electron volts owing to induction heating, and the electrical conductivity drops by an order of magnitude. This conductivity drop leads to rapid diffusion, and thus the applied magnetic field penetrates the cone wall at this time.
Fig. 7. Line-outs of the magnetic field strength at 5.2 ns on the z axis with (i) a constant electrical conductivity of 4.07 × 10⁷ S/m, (ii) the temperature-dependent electrical conductivity based on a previous analysis,19 and (iii) the temperature-dependent electrical conductivity shown in Fig. 4 . The magnetic field strengths at the cone tip are 102, 385, and 397 T, respectively.
Fig. 8. Simple illustration of magnetic diffusion. An infinitely wide conductive plate of thickness d is placed on the x –y plane. A magnetic field is applied in the x direction outside the conductor (0 < z ). This magnetic field causes an eddy current in the y direction and diffuses into the conductive plate, causing induction heating.

Set citation alerts for the article
Please enter your email address
© Copyright 2018-2021 | Chinese Laser Press. All Rights Reserved 沪ICP备15018463号-20