• Journal of Infrared and Millimeter Waves
  • Vol. 40, Issue 1, 25 (2021)
Fei YANG*, Heng-Fei ZHAO, Jiang-Tao LIU, Rui-Zhu LIU, Yuan-Ping LIU, Feng-Jiao HU, Shu-Feng SUN, Hong-Xi YU, and Ying ZHOU
Author Affiliations
  • China Academy of Space Technology (Xi’an) , Xi’an 710100, China
  • show less
    DOI: 10.11972/j.issn.1001-9014.2021.01.005 Cite this Article
    Fei YANG, Heng-Fei ZHAO, Jiang-Tao LIU, Rui-Zhu LIU, Yuan-Ping LIU, Feng-Jiao HU, Shu-Feng SUN, Hong-Xi YU, Ying ZHOU. Solid-state power amplifiers for space: going to extremely high frequency[J]. Journal of Infrared and Millimeter Waves, 2021, 40(1): 25 Copy Citation Text show less
    Q band SSPA: (a) function diagram, (b) 3-D model of Q band SSPA, (c) photograph of material object
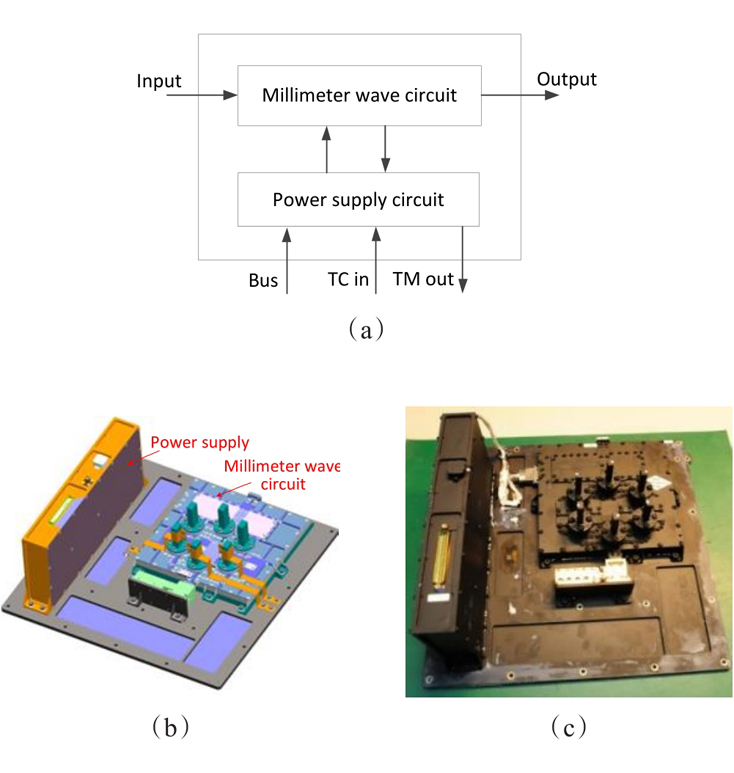
    Fig. 1. Q band SSPA: (a) function diagram, (b) 3-D model of Q band SSPA, (c) photograph of material object
    The prototype and corresponding gain and power distribution of Q band SSPA millimeter wave circuit: (a) prototype, (b) the gain and power distributions of every stage
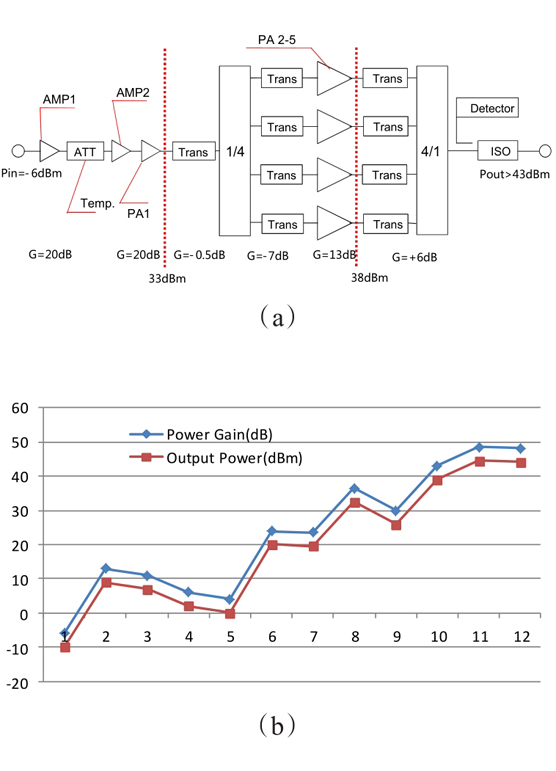
    Fig. 2. The prototype and corresponding gain and power distribution of Q band SSPA millimeter wave circuit: (a) prototype, (b) the gain and power distributions of every stage
    Q band broadband power divider/combiner (4 ways)
    Fig. 3. Q band broadband power divider/combiner (4 ways)
    Q band SSPA thermal simulation and infrared thermography: (a) shell temperature of the GaN MMICs, (b) heat flux at bottom
    Fig. 4. Q band SSPA thermal simulation and infrared thermography: (a) shell temperature of the GaN MMICs, (b) heat flux at bottom
    Q band SSPA millimeter wave circuit structure: (a) integrated structure, (b) explosion figure
    Fig. 5. Q band SSPA millimeter wave circuit structure: (a) integrated structure, (b) explosion figure
    DC/DC power supply for Q band SSPA (a) topology diagram, (b) output voltage serious simulation results, (c) efficiency vs. 20 V’s current (main power consumption part)
    Fig. 6. DC/DC power supply for Q band SSPA (a) topology diagram, (b) output voltage serious simulation results, (c) efficiency vs. 20 V’s current (main power consumption part)
    Q band SSPA measurement results (a) output power and gain vs. frequency, (b) efficiency at rated input power vs. frequency, (c) gain and output power vs. input power, (d) efficiency vs. input power
    Fig. 7. Q band SSPA measurement results (a) output power and gain vs. frequency, (b) efficiency at rated input power vs. frequency, (c) gain and output power vs. input power, (d) efficiency vs. input power
    V band 1 to 8/8 to 1 divider/combiner simulation model and results (a) simulation model, transition and reflections simulation results, (b) transition coefficient, (c) reflection of divide ports, (d) isolation between divide ports
    Fig. 8. V band 1 to 8/8 to 1 divider/combiner simulation model and results (a) simulation model, transition and reflections simulation results, (b) transition coefficient, (c) reflection of divide ports, (d) isolation between divide ports
    End stage of V band SSPA (a) design structure (model and explosive), (b) fabricated V band end stage SSPA (Input side; GaN MMICs units and output side)
    Fig. 9. End stage of V band SSPA (a) design structure (model and explosive), (b) fabricated V band end stage SSPA (Input side; GaN MMICs units and output side)
    V band SSPA product and measured results (a) photograph, (b) measurement results
    Fig. 10. V band SSPA product and measured results (a) photograph, (b) measurement results
    W band SSPA millimeter wave circuit (a) millimeter wave circuit schematic, (b) integration structure and explosion figure
    Fig. 11. W band SSPA millimeter wave circuit (a) millimeter wave circuit schematic, (b) integration structure and explosion figure
    W band magic T model and simulation result (a) model and transmission coefficient, (b) reflection and isolation coefficient
    Fig. 12. W band magic T model and simulation result (a) model and transmission coefficient, (b) reflection and isolation coefficient
    Power supplier circuit schematic and efficiency curve (a) schematic, (b) output voltage serious, (c) efficiency vs. 15 V’s current (main power consumption part)
    Fig. 13. Power supplier circuit schematic and efficiency curve (a) schematic, (b) output voltage serious, (c) efficiency vs. 15 V’s current (main power consumption part)
    W band SSPA photograph and measurement results (a) photograph, (b) measurement results
    Fig. 14. W band SSPA photograph and measurement results (a) photograph, (b) measurement results
    V band SSPA and W band SSPA of references (a) V band SSPA of Ref. [6], (b) W band SSPA of Ref. [19]
    Fig. 15. V band SSPA and W band SSPA of references (a) V band SSPA of Ref. [6], (b) W band SSPA of Ref. [19]
    Ref.FrequencyOutput powerGainEfficiencyState
    [3]33.5~38 GHz8~21 W14~16 dB8%~21% (Millimeter wave part)Model piece
    [6]59~63 GHz12.8 W (peak)34 dB16% (Millimeter wave part)Model piece
    [9]80~100 GHz29~33 dBm8~12 dBm/MMIC
    [19]94~98 GHz2.5~5 W18 dB7% (Millimeter wave part)Model piece
    This work37~42 GHz20~30 W50 dB7%~10% (with power supply)Space qualified
    This work47~52 GHz>10 W>26 dB9.5%~11.5% (Millimeter wave part)Ground transmitter
    This work92~96 GHz2~3.5 W>31 dB4.5%~7.1% (with power supply)Space qualified
    Table 1. Compare with latest literatures
    Fei YANG, Heng-Fei ZHAO, Jiang-Tao LIU, Rui-Zhu LIU, Yuan-Ping LIU, Feng-Jiao HU, Shu-Feng SUN, Hong-Xi YU, Ying ZHOU. Solid-state power amplifiers for space: going to extremely high frequency[J]. Journal of Infrared and Millimeter Waves, 2021, 40(1): 25
    Download Citation