
Gao-Feng Jiao, Keye Zhang, L. Q. Chen, Chun-Hua Yuan, Weiping Zhang, "Quantum non-demolition measurement based on an SU(1,1)-SU(2)-concatenated atom-light hybrid interferometer," Photonics Res. 10, 475 (2022)
- Photonics Research
- Vol. 10, Issue 2, 475 (2022)
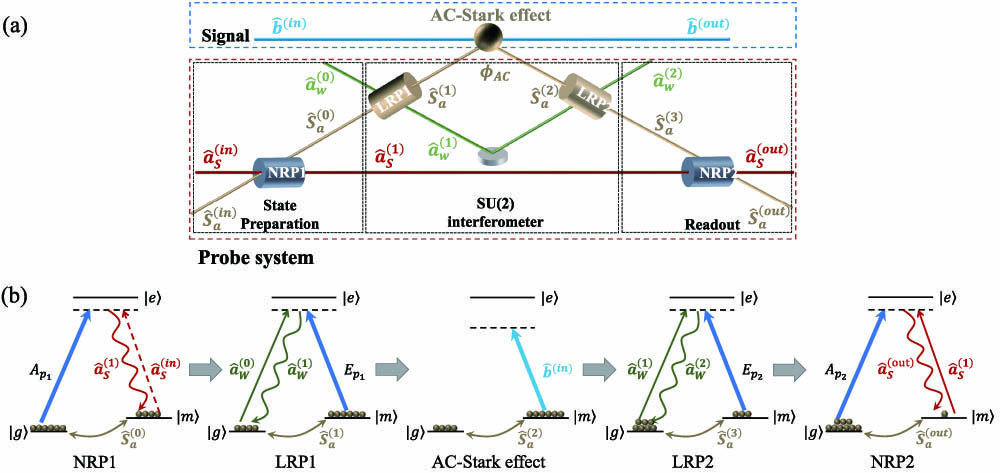
Fig. 1. (a) Schematic of QND measurement of photon number. The probe system consists of an SU(1,1)-SU(2)-concatenated atom–light hybrid interferometer. In the SU(2) interferometer in the middle box, the LRP is utilized to realize the splitting and combination of the atomic spin wave and the optical wave. a ^ W ( 0 ) S ^ a ( 0 ) S ^ a ( 1 ) S ^ a ( 3 ) S ^ a ( 1 ) ϕ AC b ^ ( in ) S ^ a ( 2 ) S ^ a ( 3 ) a ^ S ( 1 ) S ^ a ( 0 ) LRP NRP | g ⟩ | m ⟩ | e ⟩ A p 1 A p 2 E p 1 E p 2 | g ⟩ → | e ⟩ | m ⟩ → | e ⟩ b ^ ( in ) | m ⟩ → | e ⟩
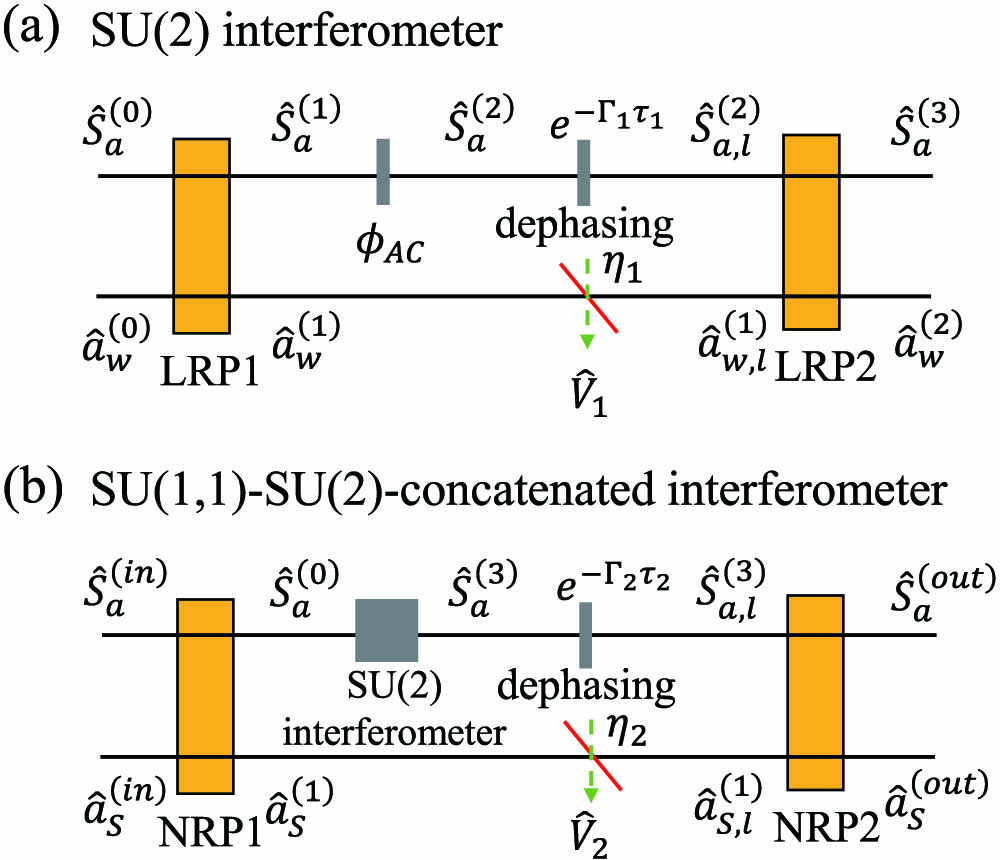
Fig. 2. Lossy interferometer model with (a) internal loss and (b) external loss.
Fig. 3. Correlation coefficient C η 1 η 2 e − Γ 1 τ 1 = e − Γ 2 τ 2 = 0.9 κ = 10 − 10 , g 1 = g 2 = 3 N α = 10 12 N β = 10 8 C 0
Fig. 4. Contour line of optimized g 2 / g 1 η 1 η 2 e − Γ 1 τ 1 = e − Γ 2 τ 2 = 0.9 κ = 10 − 10 g 1 = 3 N α = 10 12 N β = 10 8 C 0 C 1


Set citation alerts for the article
Please enter your email address

© Copyright 2018-2021 | Chinese Laser Press. All Rights Reserved 沪ICP备15018463号-20