• Photonics Research
  • Vol. 12, Issue 4, 833 (2024)
Woongseob Han1、†, Jae-Won Lee2、†, Jung-Yeop Shin2, Myeong-Ho Choi1, Hak-Rin Kim2、3、5、*, and Jae-Hyeung Park1、4、6、*
Author Affiliations
  • 1Department of Electrical and Computer Engineering, Inha University, 100 Inha-ro, Michuhol-gu, Incheon 22212, Republic of Korea
  • 2School of Electronic and Electrical Engineering, Kyungpook National University, 80 Daehak-ro, Buk-gu, Daegu 41566, Republic of Korea
  • 3School of Electronics Engineering, Kyungpook National University, 80 Daehak-ro, Buk-gu, Daegu 41566, Republic of Korea
  • 4Department of Information and Communication Engineering, Inha University, 100 Inha-ro, Michuhol-gu, Incheon 22212, Republic of Korea
  • 5e-mail: rineey@knu.ac.kr
  • 6e-mail: jh.park@inha.ac.kr
  • show less
    DOI: 10.1364/PRJ.509948 Cite this Article Set citation alerts
    Woongseob Han, Jae-Won Lee, Jung-Yeop Shin, Myeong-Ho Choi, Hak-Rin Kim, Jae-Hyeung Park. Varifocal occlusion in an optical see-through near-eye display with a single phase-only liquid crystal on silicon[J]. Photonics Research, 2024, 12(4): 833 Copy Citation Text show less
    Simulated AR scene (a) without occlusion and (b) with occlusion by Blender. In the pictures, the merchant and store are regarded as a virtual image and a real scene, respectively. The transparency of the merchant in (a) and (b) was set to 50% and 0%, respectively, to simulate the conventional and occlusion-supported AR scene. Source image: “The Junk Shop” by Alex Treviño. Original concept by Anaïs Maamar.
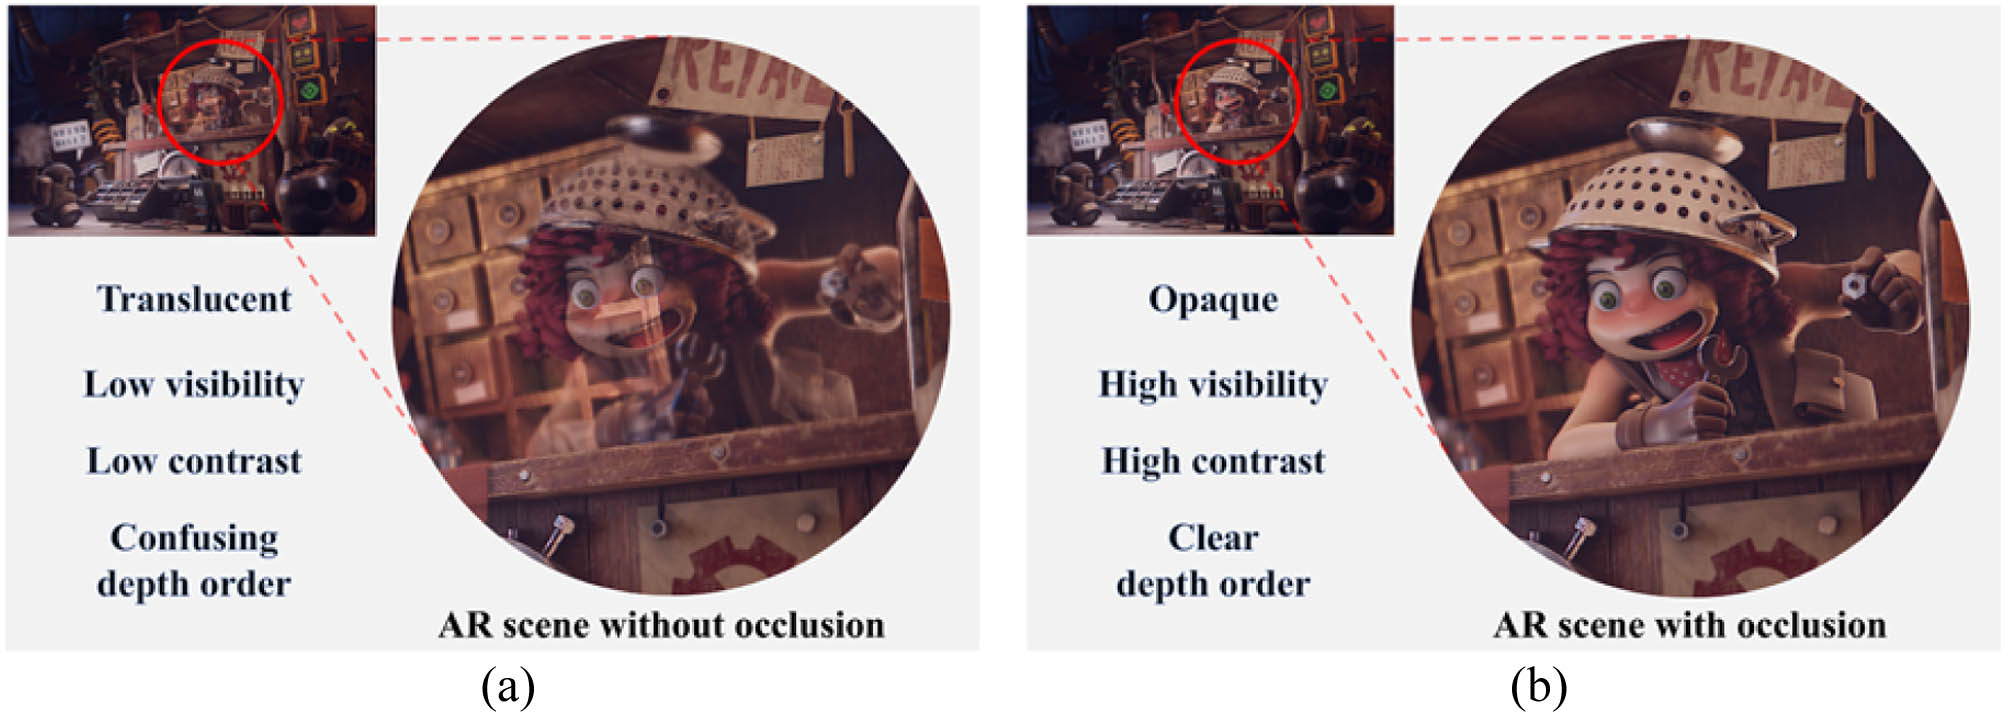
    Fig. 1. Simulated AR scene (a) without occlusion and (b) with occlusion by Blender. In the pictures, the merchant and store are regarded as a virtual image and a real scene, respectively. The transparency of the merchant in (a) and (b) was set to 50% and 0%, respectively, to simulate the conventional and occlusion-supported AR scene. Source image: “The Junk Shop” by Alex Treviño. Original concept by Anaïs Maamar.
    Simplified optics of the proposed varifocal occlusion when the light source is located at (a) focal length and (b) other distance from the convex type FTL.
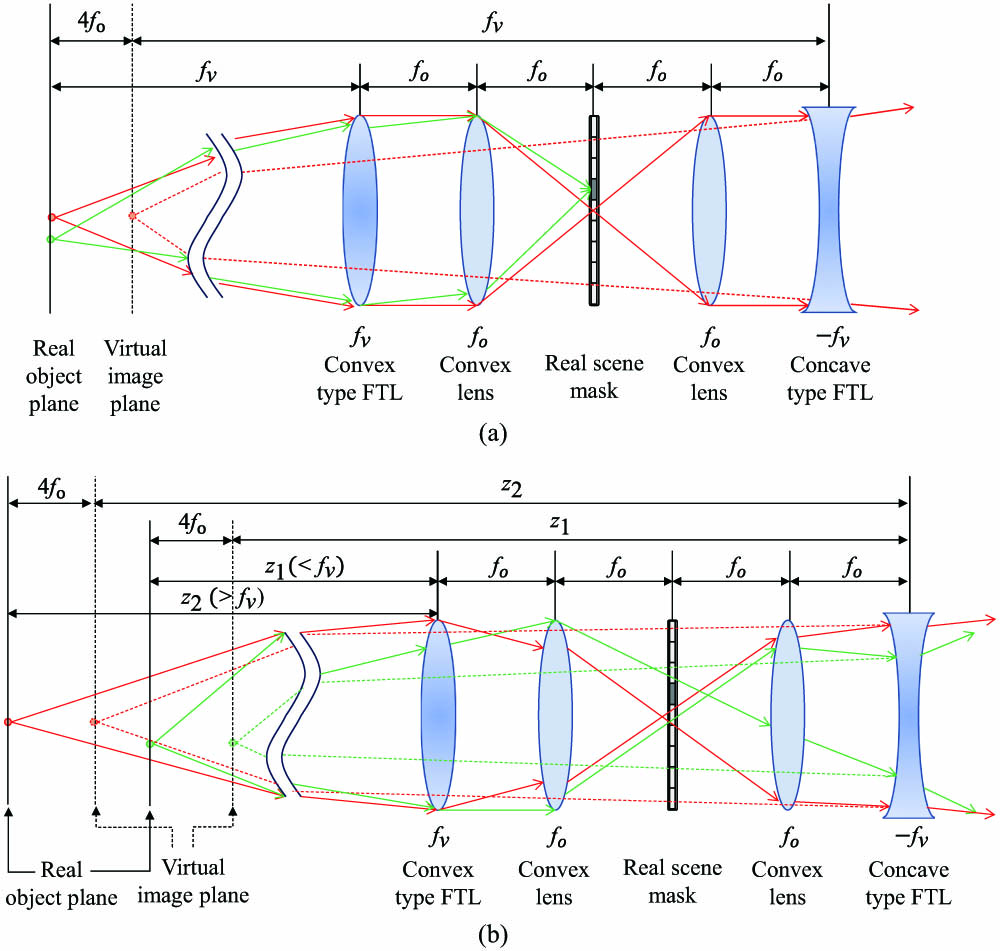
    Fig. 2. Simplified optics of the proposed varifocal occlusion when the light source is located at (a) focal length and (b) other distance from the convex type FTL.
    Schematic diagram of the two-FTLs optics.
    Fig. 3. Schematic diagram of the two-FTLs optics.
    Schematic diagram of the two liquid-based FTL optics with light path of real objects and binary virtual image reflected on (a) a nonmasking pixel, and (b) a masking pixel of the LCoS. Blue and green lines indicate the light trajectory of real objects and virtual images, respectively.
    Fig. 4. Schematic diagram of the two liquid-based FTL optics with light path of real objects and binary virtual image reflected on (a) a nonmasking pixel, and (b) a masking pixel of the LCoS. Blue and green lines indicate the light trajectory of real objects and virtual images, respectively.
    Schematic diagram of a single FTL optics.
    Fig. 5. Schematic diagram of a single FTL optics.
    Polarization optics of the proposed method with light path of (a) the real object and (b) the virtual image. Red bold rectangle indicates output polarization of each case.
    Fig. 6. Polarization optics of the proposed method with light path of (a) the real object and (b) the virtual image. Red bold rectangle indicates output polarization of each case.
    Visibility of the real scene and virtual scene according to the LCoS retardation and HWP rotation angle when φ=−2θ. Bold red double-sided arrows indicate the retardation range used in grayscale imaging.
    Fig. 7. Visibility of the real scene and virtual scene according to the LCoS retardation and HWP rotation angle when φ=2θ. Bold red double-sided arrows indicate the retardation range used in grayscale imaging.
    Operation scheme of the time-multiplexed grayscale imaging.
    Fig. 8. Operation scheme of the time-multiplexed grayscale imaging.
    Picture of the experiment setup of two-FTLs optics.
    Fig. 9. Picture of the experiment setup of two-FTLs optics.
    Experiment setup of the single FTL optics.
    Fig. 10. Experiment setup of the single FTL optics.
    Captured photos of the occlusion test with/without the illumination from the fiber laser.
    Fig. 11. Captured photos of the occlusion test with/without the illumination from the fiber laser.
    Captured photos of the real scene at 50 cm (= 2D) while the virtual image is at 33, 50, 100 cm, and optical infinity.
    Fig. 12. Captured photos of the real scene at 50 cm (= 2D) while the virtual image is at 33, 50, 100 cm, and optical infinity.
    Time-multiplexed experimental result for grayscale imaging. In the time multiplexing, the mask and image subframes are alternately displayed at 10 Hz. The pictures were taken with a camera setting of ISO 50 and a 1 s shutter speed.
    Fig. 13. Time-multiplexed experimental result for grayscale imaging. In the time multiplexing, the mask and image subframes are alternately displayed at 10 Hz. The pictures were taken with a camera setting of ISO 50 and a 1 s shutter speed.
    Experiment result of the grayscale imaging with the time-multiplexing scheme. The real target of the yellow fish and the background is located at 25 cm and 50 cm while the virtual images are at 33 cm.
    Fig. 14. Experiment result of the grayscale imaging with the time-multiplexing scheme. The real target of the yellow fish and the background is located at 25 cm and 50 cm while the virtual images are at 33 cm.
    Comparison of the AR scene with occlusion and without occlusion. Both pictures were taken with the same camera setting of ISO 50 and a 1 s shutter speed.
    Fig. 15. Comparison of the AR scene with occlusion and without occlusion. Both pictures were taken with the same camera setting of ISO 50 and a 1 s shutter speed.
    Experiment results of the full-color imaging. The real target of the satellite and background is placed at 30 cm and 150 cm while the virtual image of the spaceman is at 70 cm. Camera setting: ISO 50 and 2 s shutter speed.
    Fig. 16. Experiment results of the full-color imaging. The real target of the satellite and background is placed at 30 cm and 150 cm while the virtual image of the spaceman is at 70 cm. Camera setting: ISO 50 and 2 s shutter speed.
    Feasibility test of varifocal occlusion using a single PBP-type FTL.
    Fig. 17. Feasibility test of varifocal occlusion using a single PBP-type FTL.
    Grayscale image presentation using a single PBP-type FTL setup (Visualization 1).
    Fig. 18. Grayscale image presentation using a single PBP-type FTL setup (Visualization 1).
    (a) Fabrication process of the PBP lens and (b) phase profiles of the PBP lens with the polarization-dependent focal lengths of ±100 cm and ±70 cm, taken through the macroscopic CCD image sensor and polarizing optical microscope, where the PBP lenses are placed between the crossed polarizers.
    Fig. 19. (a) Fabrication process of the PBP lens and (b) phase profiles of the PBP lens with the polarization-dependent focal lengths of ±100  cm and ±70  cm, taken through the macroscopic CCD image sensor and polarizing optical microscope, where the PBP lenses are placed between the crossed polarizers.
    (a) and (b) The polarization-dependent focusing (+f) and defocusing properties of the PBP lens and their polarization conversion states according to the light incident directions. (c) Simplified analysis of the polarization states and magnification cancellation effects after the round-trip light propagation through the single PBP lens by the mirror reflection.
    Fig. 20. (a) and (b) The polarization-dependent focusing (+f) and defocusing properties of the PBP lens and their polarization conversion states according to the light incident directions. (c) Simplified analysis of the polarization states and magnification cancellation effects after the round-trip light propagation through the single PBP lens by the mirror reflection.
    Polarization change schemes of real scenes and virtual AR images for varifocal self-aligned mutual occlusion effects constructed by the PBP-type FTL module, where two PBP-type FTLs are cascaded and their incident polarization states are controlled by the LC-based SHWP1 and SHWP2 cells for (a) the near-depth and (b) far-depth AR imaging switching with pixelized occlusions.
    Fig. 21. Polarization change schemes of real scenes and virtual AR images for varifocal self-aligned mutual occlusion effects constructed by the PBP-type FTL module, where two PBP-type FTLs are cascaded and their incident polarization states are controlled by the LC-based SHWP1 and SHWP2 cells for (a) the near-depth and (b) far-depth AR imaging switching with pixelized occlusions.
    Unfolded optics of polarization-based occlusion. Bold orange arrow in the LCoS indicates the direction of the LCs aligned in parallel and an x coordinate is reversed after reflection in the reflective-type LCoS.
    Fig. 22. Unfolded optics of polarization-based occlusion. Bold orange arrow in the LCoS indicates the direction of the LCs aligned in parallel and an x coordinate is reversed after reflection in the reflective-type LCoS.
    Visibility of the real scene and the virtual scene when the incident light is monochromatic.
    Fig. 23. Visibility of the real scene and the virtual scene when the incident light is monochromatic.
    Visibility of the real scene in the full-color spectrum when the phase retardation of the LCoS is optimized to each RGB color.
    Fig. 24. Visibility of the real scene in the full-color spectrum when the phase retardation of the LCoS is optimized to each RGB color.
    Average visibility of the real scene over the full-color range when the phase retardation of the LCoS is optimized to wavelengths of (a) 450 nm, (b) 520 nm, and (c) 638 nm. The vertical bars indicate the variance of the real scene visibility over the full-color range at each HWP rotation angle.
    Fig. 25. Average visibility of the real scene over the full-color range when the phase retardation of the LCoS is optimized to wavelengths of (a) 450 nm, (b) 520 nm, and (c) 638 nm. The vertical bars indicate the variance of the real scene visibility over the full-color range at each HWP rotation angle.
    Visibility of the real scene and virtual scene according to the LCoS retardation and HWP rotation angle when φ=2θ.
    Fig. 26. Visibility of the real scene and virtual scene according to the LCoS retardation and HWP rotation angle when φ=2θ.
    (a) Experimental setup for measuring the occlusion ratio. (b) Captured result and ROI used to calculate the occlusion ratio of the masking pixel. (c) Intensity distribution of the center line in the ROI indicated as a yellow line.
    Fig. 27. (a) Experimental setup for measuring the occlusion ratio. (b) Captured result and ROI used to calculate the occlusion ratio of the masking pixel. (c) Intensity distribution of the center line in the ROI indicated as a yellow line.
    Experimental result of the contrast measurement under moderate real background luminance when φ=−2θ.
    Fig. 28. Experimental result of the contrast measurement under moderate real background luminance when φ=2θ.
    Experimental result of the contrast measurement under strong real background luminance when φ=2θ.
    Fig. 29. Experimental result of the contrast measurement under strong real background luminance when φ=2θ.
    Woongseob Han, Jae-Won Lee, Jung-Yeop Shin, Myeong-Ho Choi, Hak-Rin Kim, Jae-Hyeung Park. Varifocal occlusion in an optical see-through near-eye display with a single phase-only liquid crystal on silicon[J]. Photonics Research, 2024, 12(4): 833
    Download Citation