
Gui-Shi Liu, Xin Xiong, Shiqi Hu, Weicheng Shi, Yaofei Chen, Wenguo Zhu, Huadan Zheng, Jianhui Yu, Nur Hidayah Azeman, Yunhan Luo, Zhe Chen, "Photonic cavity enhanced high-performance surface plasmon resonance biosensor," Photonics Res. 8, 448 (2020)
- Photonics Research
- Vol. 8, Issue 4, 448 (2020)
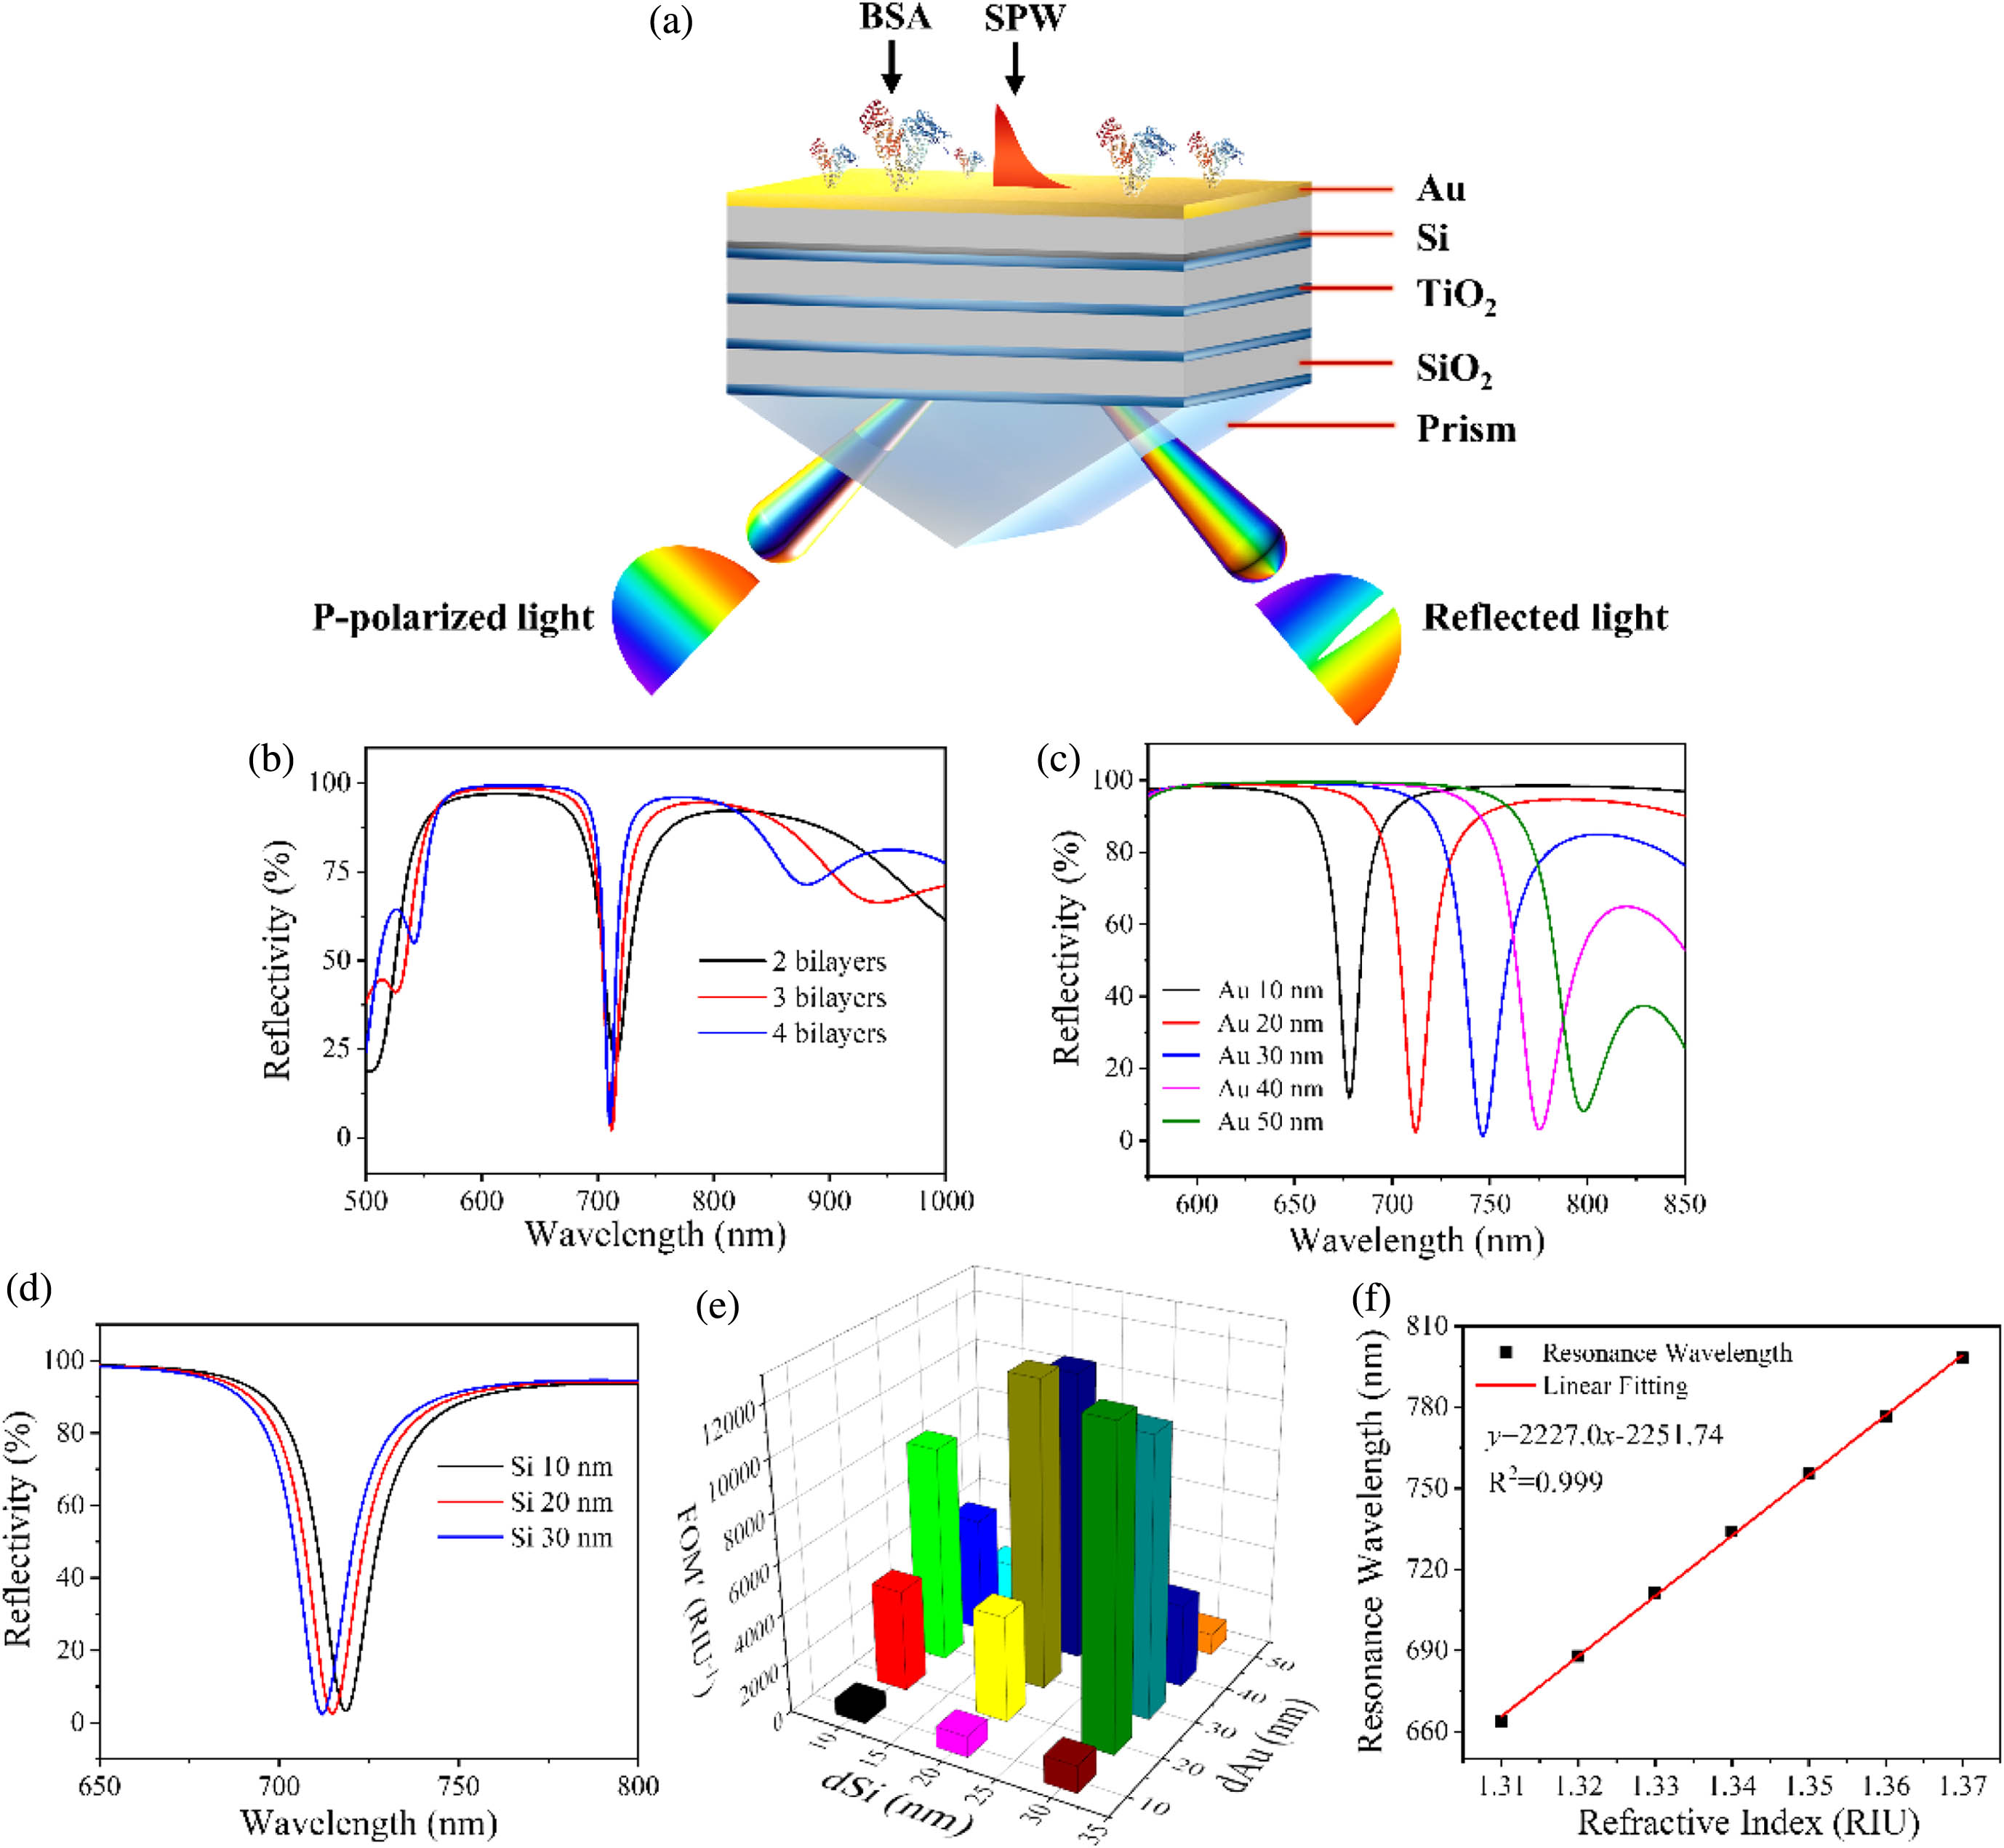
Fig. 1. (a) Schematic diagram of the proposed PC-SPR sensor. Simulated reflectance spectra of the sensor with (b) different bilayers of TiO2/SiO2, (c) different d Au at 30 nm Si layer, and (d) different d Si at 20 nm Au layer. The ambient RI is 1.33 for the simulations. (e) Performance of the sensor with different d Si and d Au. (f) Linear fitting of the resonant wavelength of the optimized PC-SPR device versus ambient refractive index of 1.31–1.37.
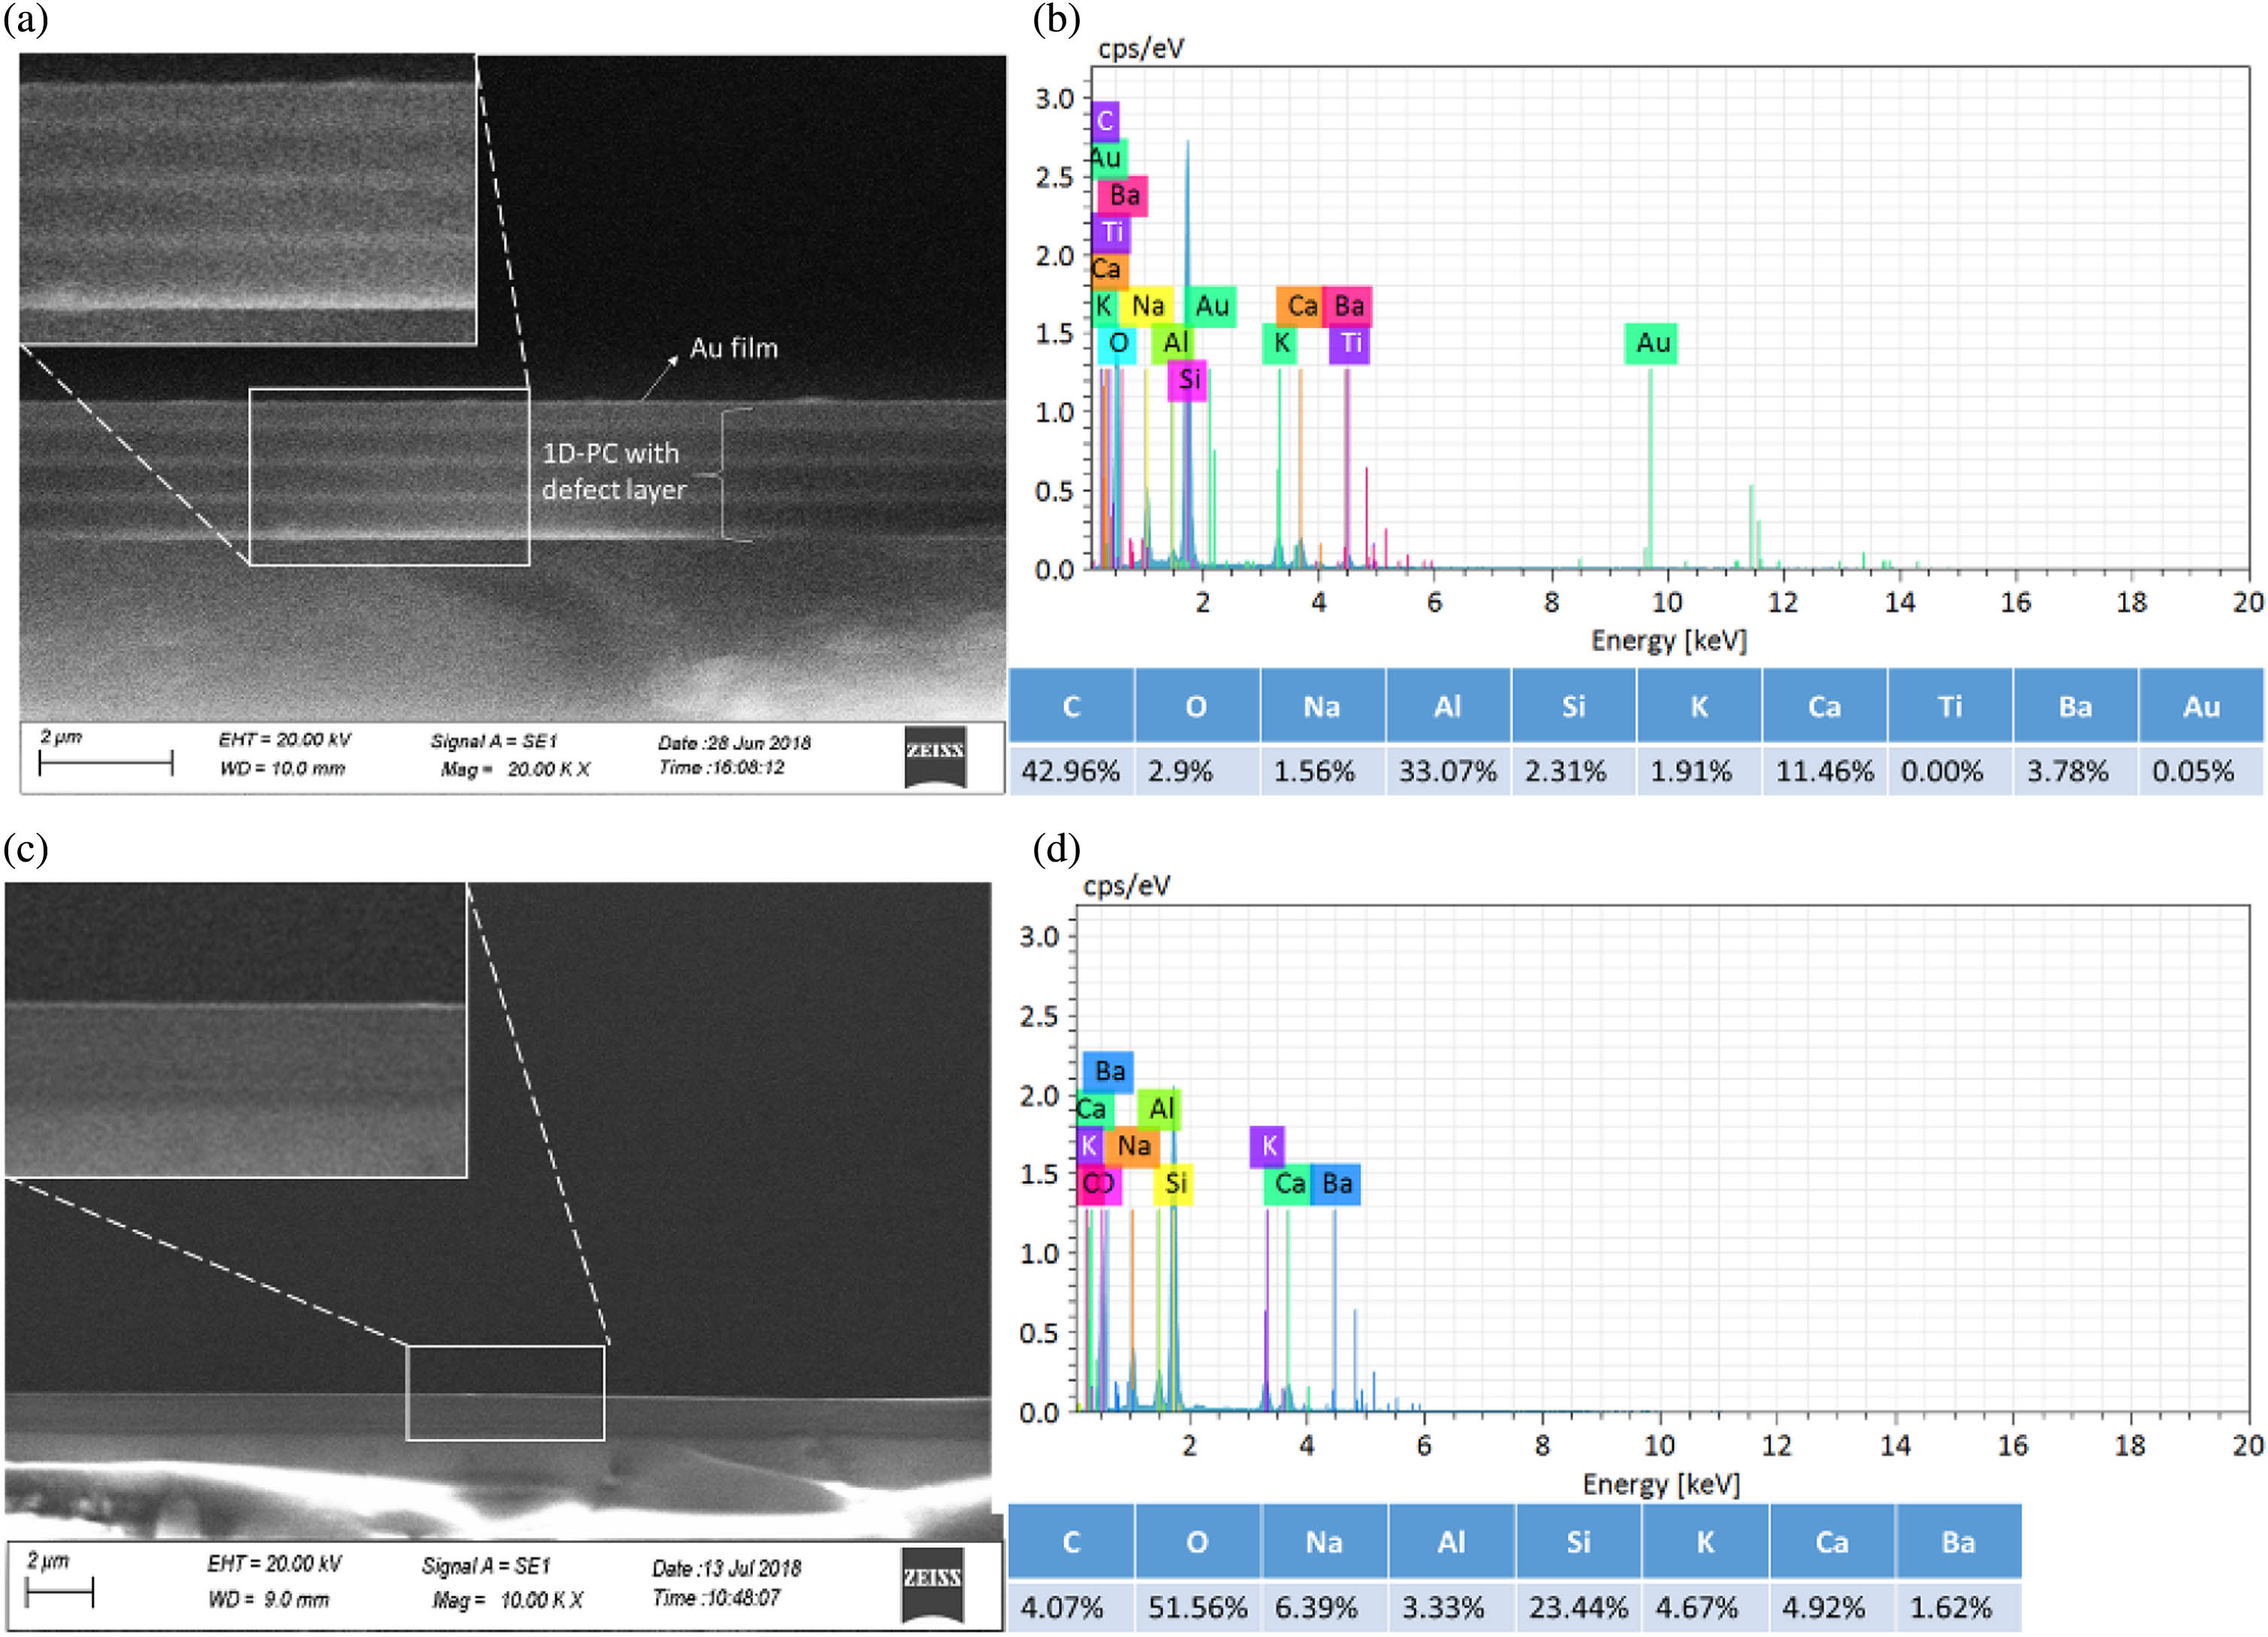
Fig. 2. (a) SEM image of the cross-sectional PC-Au on a glass substrate and (b) the corresponding EDS spectrum. (c) SEM image of the cross-sectional glass substrate and (d) the corresponding EDS spectrum.
Fig. 3. (a) Reflectance spectra of the PC-SPR sensors for the liquid RI changing from 1.31 to 1.37, (b) linear fitting of the resonant wavelength versus ambient refractive index, (c) reflectance spectra of the 50 nm Au-SPR sensor with the RI ranging from 1.31 to 1.37, and (d) polynomial and linear fitting of the resonant wavelength versus ambient RI.
Fig. 4. Comparison of the Au-SPR and PC-SPR sensors in terms of (a) sensitivity, (b) FWHM, (c) FOM, and (d) average FOM enhancement. The standard deviations are obtained from three tests with different sensors.
Fig. 5. Distribution of electric field intensity of (a), (c) the conventional 50 nm Au-SPR sensor and (b), (d) the PC-SPR sensor. The field intensity is obtained using finite-difference time-domain (FDTD) simulations provided by the Lumerical Solutions software.
Fig. 6. Reflectance spectra for the PC-SPR sensors versus BSA concentration ranging from 0 to 15 mg · mL − 1
|
Table 1. Comparison of the PC-SPR Sensor and Other SPR Sensors


Set citation alerts for the article
Please enter your email address

© Copyright 2018-2021 | Chinese Laser Press. All Rights Reserved 沪ICP备15018463号-20