• Laser & Optoelectronics Progress
  • Vol. 57, Issue 21, 211203 (2020)
Ye Han1, Weng Zuxin1, Zhang Yunhai2、*, Miu Jia3, and Xiao Yun2
Author Affiliations
  • 1南昌大学机电工程学院, 江西 南昌 330031
  • 2中国科学院苏州生物医学工程技术研究所江苏省医用光学重点实验室, 江苏 苏州 215163
  • 3江苏省医疗器械检验所, 南京 210019
  • show less
    DOI: 10.3788/LOP57.211203 Cite this Article Set citation alerts
    Ye Han, Weng Zuxin, Zhang Yunhai, Miu Jia, Xiao Yun. Surface Roughness Measurement Using Laser Confocal Microscope with Boundary Area Correction[J]. Laser & Optoelectronics Progress, 2020, 57(21): 211203 Copy Citation Text show less
    Transmission coefficients of roughness and waviness contours
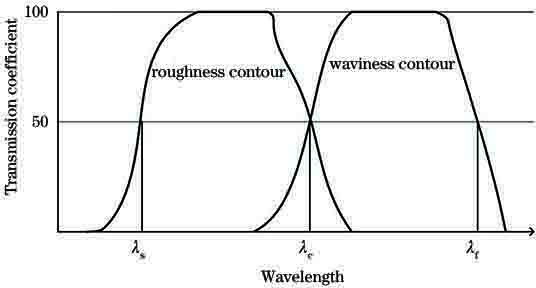
    Fig. 1. Transmission coefficients of roughness and waviness contours
    Steps for extracting roughness contours
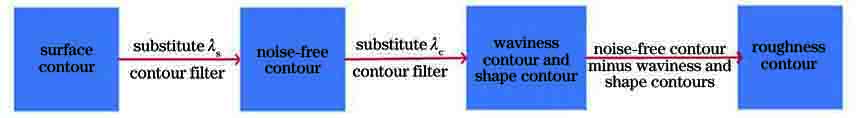
    Fig. 2. Steps for extracting roughness contours
    Unfiltered contour and filtered contour
    Fig. 3. Unfiltered contour and filtered contour
    Extended original contour and filtered contour
    Fig. 4. Extended original contour and filtered contour
    Original contour and filtered contours using different methods
    Fig. 5. Original contour and filtered contours using different methods
    Sample map and layer-by-layer confocal imaging results. (a)(b) Gentle samples; (c)(d) steep samples
    Fig. 6. Sample map and layer-by-layer confocal imaging results. (a)(b) Gentle samples; (c)(d) steep samples
    Reconstructed 3D contours of samples. (a) Smooth sample; (b) steep sample
    Fig. 7. Reconstructed 3D contours of samples. (a) Smooth sample; (b) steep sample
    Experimental results of smooth sample. (a) Conventional method; (b) boundary area correction method
    Fig. 8. Experimental results of smooth sample. (a) Conventional method; (b) boundary area correction method
    Experimental results of steep sample. (a) Conventional method; (b) boundary area correction method
    Fig. 9. Experimental results of steep sample. (a) Conventional method; (b) boundary area correction method
    MethodVariance
    Normal method1.1082
    Improved method0.4231
    Table 1. Variance of actual contour and filtered contour treated by using two methods
    Roughnesslr /mm
    0.02 mm≤Ra<0.10 mm0.25
    0.10 mm≤Ra<2.00 mm0.80
    2.00 mm≤Ra<10.00 mm2.50
    10.00 mm≤Ra<80.00 mm8.00
    Table 2. Selection criteria for sampling length lr
    λc /mmλs /μm
    0.252.5
    0.82.5
    2.58
    8.025
    Table 3. Selection criteria for cut-off wavelength
    MethodRa /μmAveragevalue /μmRelativeerror /%RMSE
    12345678
    Normal method2.862.882.872.862.872.852.842.862.862.720.080
    Improved method2.852.872.862.862.872.842.832.852.853.060.090
    Table 4. Roughness value Ra of smooth sample
    MethodRa /μmAveragevalue /μmRelativeerror /%RMSE
    12345678
    Normal method3.293.303.403.343.273.363.313.223.313.480.12
    Improved method3.173.223.233.193.163.253.203.103.190.310.045
    Table 5. Roughness value Ra of steep sample
    Ye Han, Weng Zuxin, Zhang Yunhai, Miu Jia, Xiao Yun. Surface Roughness Measurement Using Laser Confocal Microscope with Boundary Area Correction[J]. Laser & Optoelectronics Progress, 2020, 57(21): 211203
    Download Citation