
Fan Li, Le Kang, Fugui Yang, Chunxia Yao, Peiping Zhu, Ming Li, Weifan Sheng. Present Research Status of X-Ray Near-Field Speckle Based Wavefront Metrology[J]. Acta Optica Sinica, 2022, 42(8): 0800002
- Acta Optica Sinica
- Vol. 42, Issue 8, 0800002 (2022)
![Normalized speckle size varying with normalized distance[68]](/richHtml/gxxb/2022/42/8/0800002/img_1.jpg)
Fig. 1. Normalized speckle size varying with normalized distance[68]
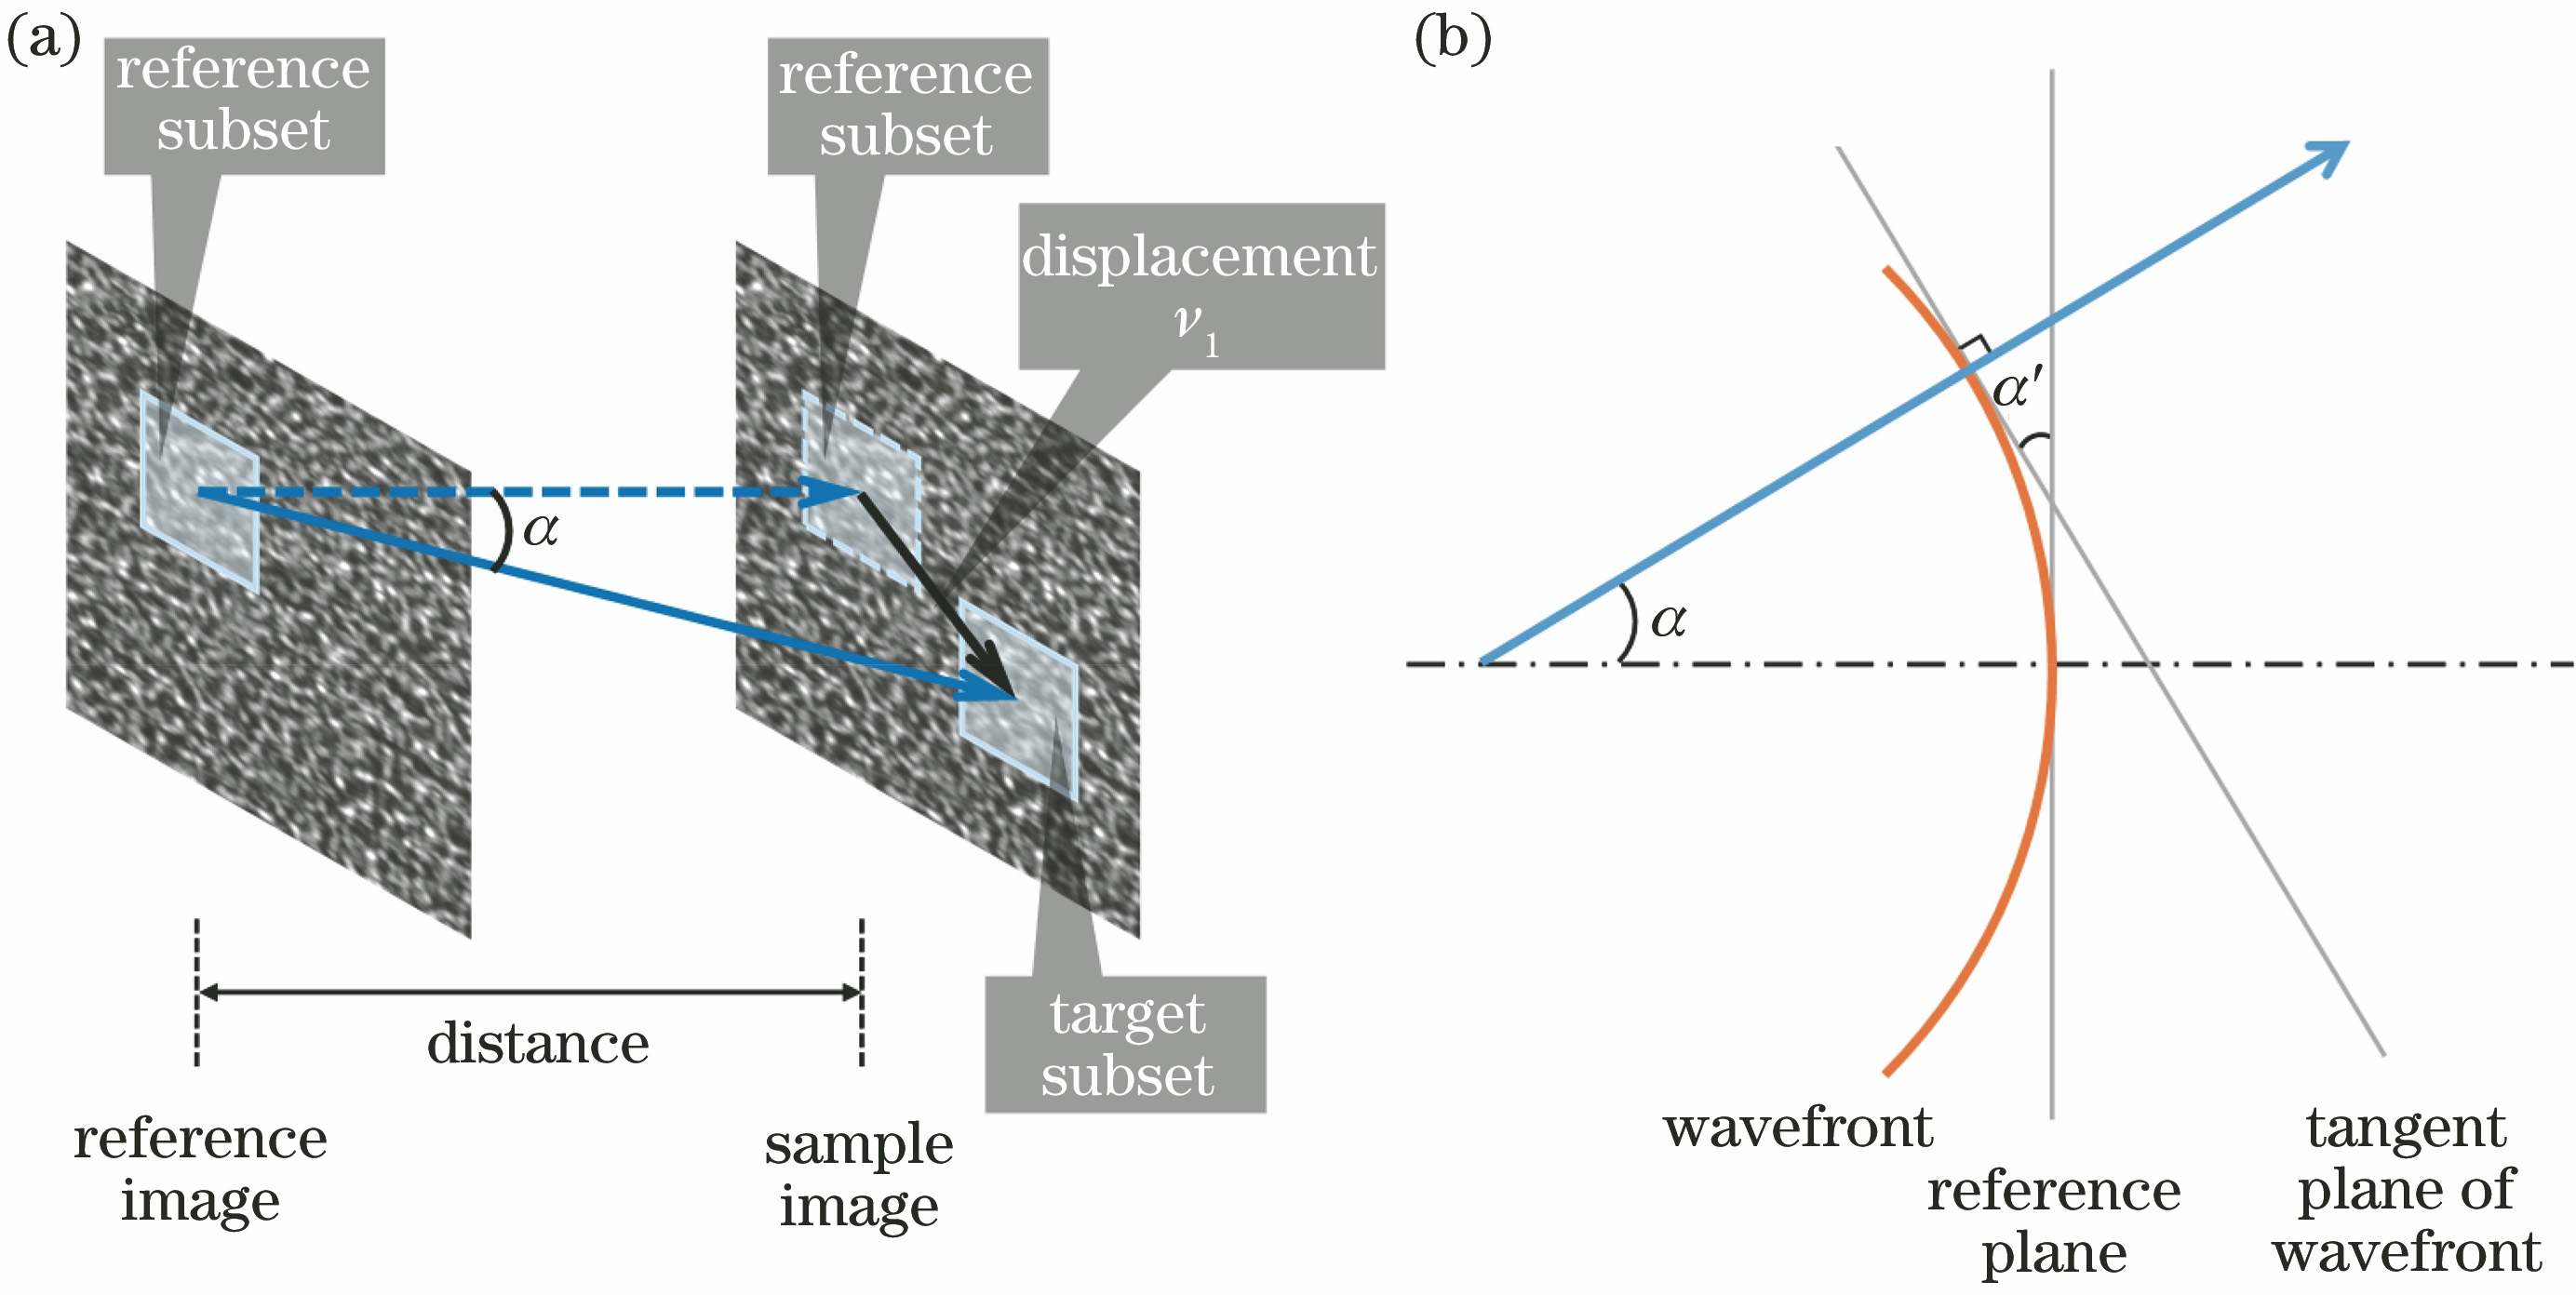
Fig. 2. Schematic diagram of wavefront reconstruction using X-ray near-field speckle. (a) Speckle displacement v1 and refraction angle α measured by matching reference subset and target subset; (b) schematic diagram of wavefront reconstruction using refraction angle α
Fig. 3. Schematic diagrams of two modes for X-ray near-field speckle based wavefront metrology. (a) Absolute mode; (b) differential mode
Fig. 4. Schematic diagrams of XST and XSVT. (a) XST in differential mode; (b) XSVT in differential mode
Fig. 5. Schematic diagram of XSS in differential mode
Fig. 6. Schematic diagram of self-correlation XSS
Fig. 7. Schematic diagram of PXST
Fig. 8. Data processing flow chart for PXST
Fig. 9. Wavefront of beam detected by XST [60]. (a) Optical layout; (b) result of wavefront reconstruction
Fig. 10. Plane mirror detected by XSS[37]. (a) Optical layout; (b) comparison of XSS and NOM detection results; (c) detection result comparsion of two modes of XSS; (d) profile error comparison; (e) power spectral density comparison
Fig. 11. Bimorph mirror detected and optimized by XSS[78]. (a) Optical layout, A1--A8 are electrodes of bimorph mirror; intensity distribution varying with distance between bimorph mirror and detector (b) before and (c) after optimization; focal spot size measured by gold wire scanning (d) before and (e) after optimization
Fig. 12. CRL detected by XST. (a) Picture of experimental site; (b) profile detection result of CRL; (c) comparison of XST and confocal laser scanning microscopy detection results


Set citation alerts for the article
Please enter your email address

© Copyright 2018-2021 | Chinese Laser Press. All Rights Reserved 沪ICP备15018463号-20