
Bowen Liu, Jiangtao Xu. Modeling the photon counting and photoelectron counting characteristics of quanta image sensors[J]. Journal of Semiconductors, 2021, 42(6): 062301
- Journal of Semiconductors
- Vol. 42, Issue 6, 062301 (2021)
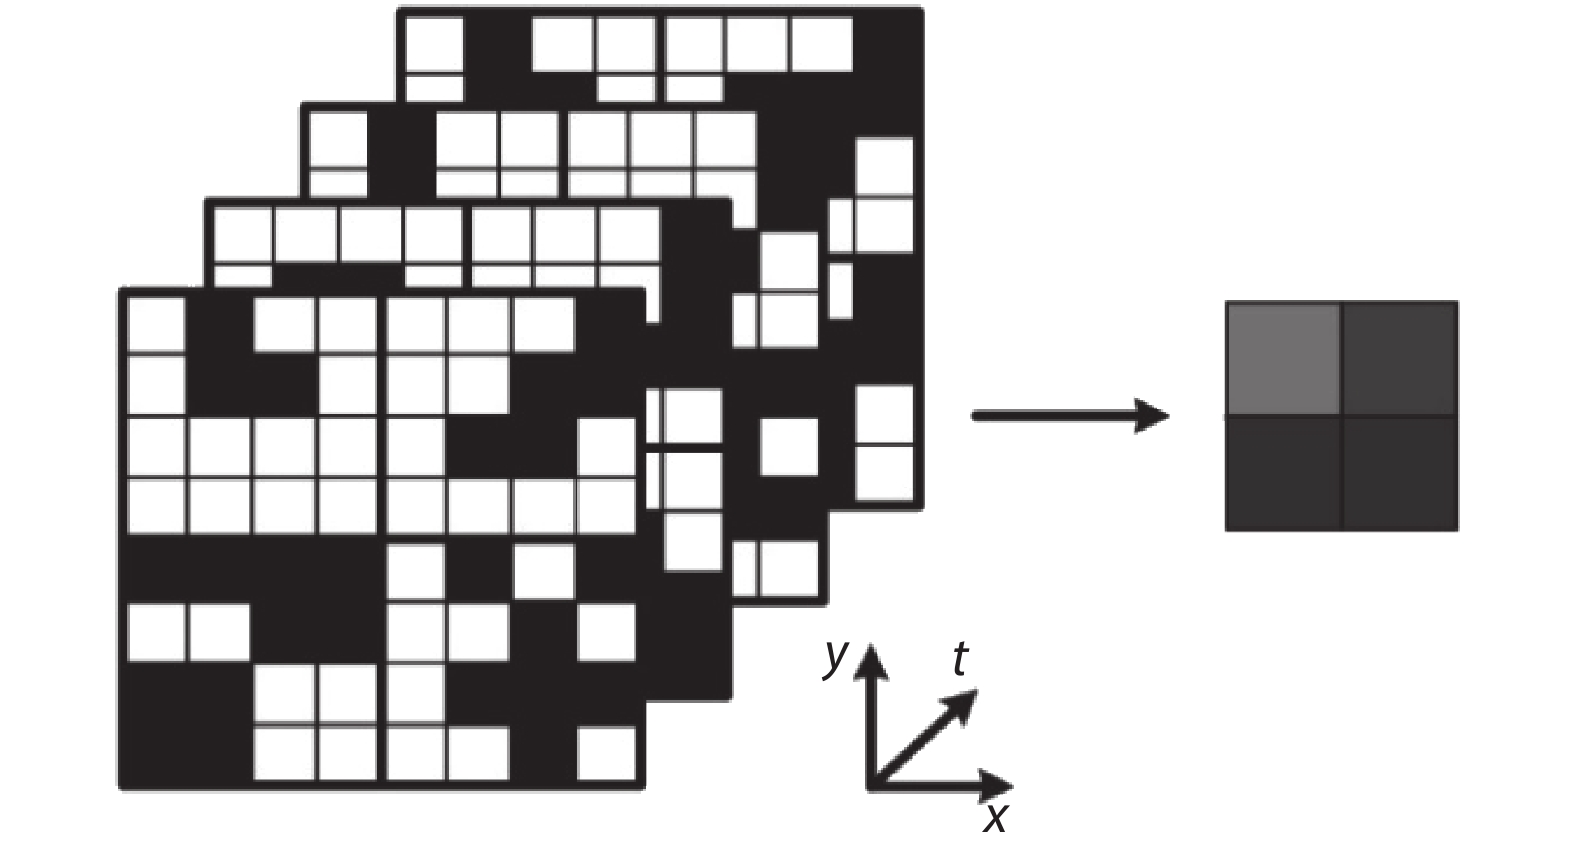
Fig. 1. The QIS conceptual illustration. An 8 × 8 × 4 spatial-temporal data cube of jots in the QIS (left) is reconstructed to a 2 × 2 data plane of pixels in the output image (right). Each data of pixels is equal to the sum of a 4 × 4 × 4 data sub-cube of jots.
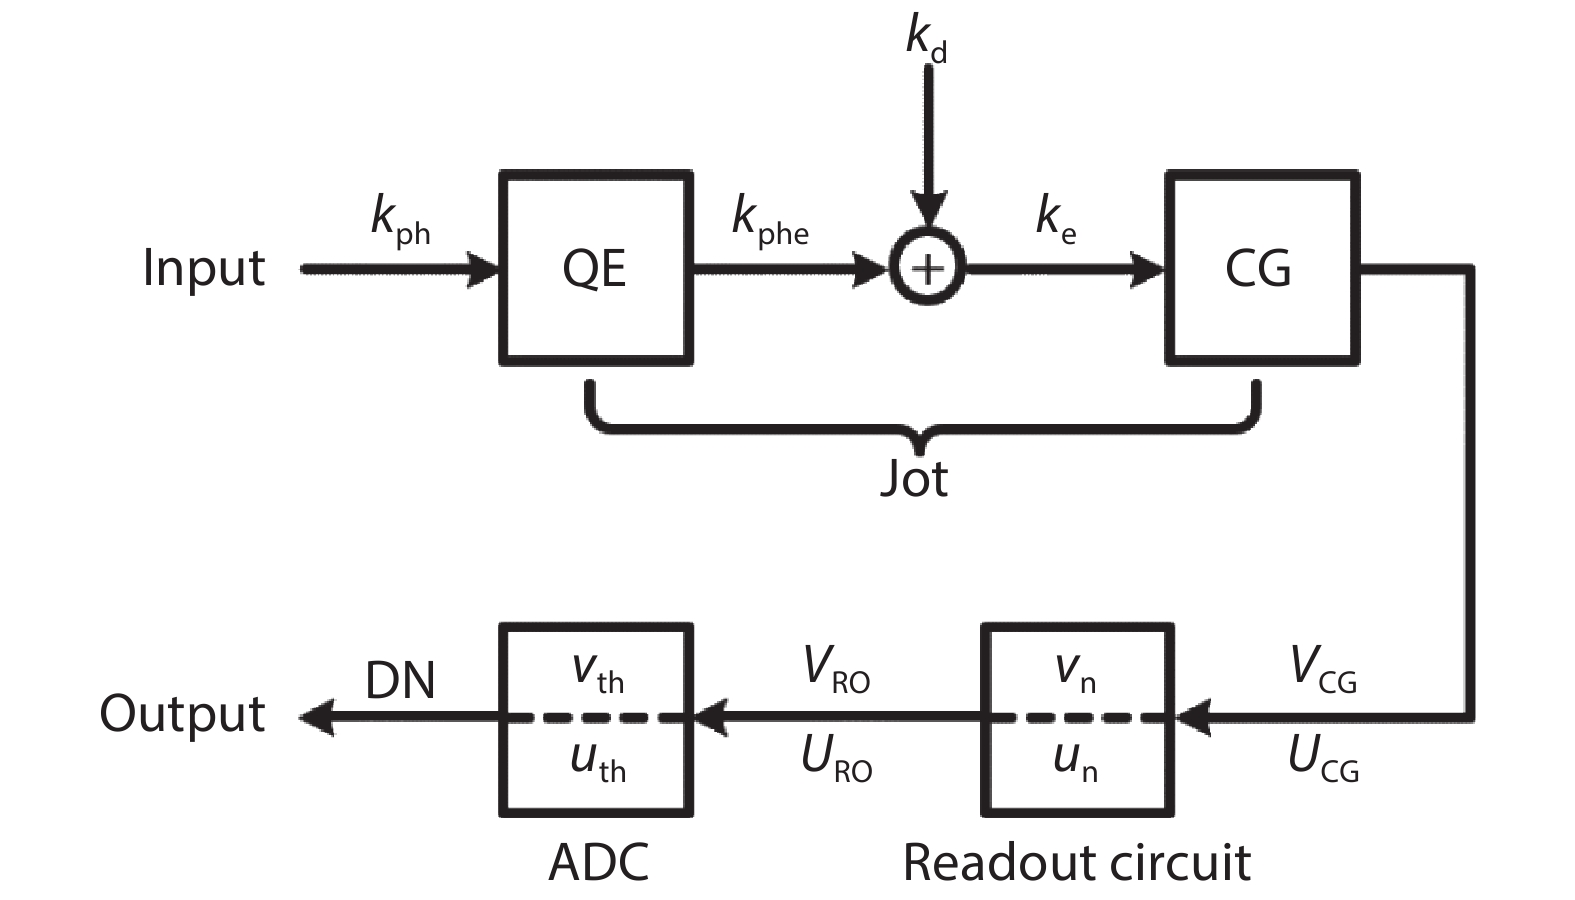
Fig. 2. The signal chain model of quanta image sensors.
Fig. 3. (Color online) The PDF P [U RO] as a function of U RO on the condition that μ e = 2 e- and u n = 0.2 e- r.m.s.. N 0, N 1, N 2, and N 3 are four quantization levels corresponding to 0, 1, 2, and 3 ADU for a 2-bit QIS. The dashed lines are three quantization boundaries corresponding to 0.5, 1.5, and 2.5 e- for a 2-bit QIS.
Fig. 4. (Color online) The ideal D -logH response curves for 1-bit to 5-bit QISs in solid lines. And the ideal linear response curves for 1-bit to 5-bit CISs in dashed lines.
Fig. 5. (Color online) The realistic response curves for the 3-bit QIS. The different conditions of curve 1 to 5 are listed in Table 2 .
Fig. 6. (Color online) The photon counting signal error rate SERph as a function of the mean value of incident photons μ ph for ideal 1-bit to 5-bit QISs.
Fig. 7. (Color online) The photon counting signal error rate SERph as a function of the mean value of incident photons μ ph for the 3-bit QIS. The five conditions of curve 1 to 5 are listed in Table 2 .
Fig. 8. (Color online) The photoelectron counting signal error rate SERphe as a function of the mean value of incident photons μ ph for the 3-bit QIS. The five conditions of curve 1 to 5 are listed in Table 2 .
Fig. 9. The conceptual illustration of the Airy disk and jot array. The Airy disk diameter D A = 3.8 μ m, the jot area A jot = 1 μ m2 (left) and A jot = 0.25 μ m2 (right).
Fig. 10. (Color online) The photon counting signal error rate SERph as a function of the mean value of incident photons μ ph for 1-bit to 5-bit QISs based on the parameters listed in Table 3 .
Fig. 11. (Color online) The photoelectron counting signal error rate SERphe as a function of the mean value of incident photons μ ph for 1-bit to 5-bit QISs based on the parameters listed in Table 3 .
Fig. 12. (Color online) The relationship between jot area A jot, the mean value of incident photons μ ph, and integration time τ under different illuminance level I lux for the 3-bit QIS in Fig. 11 . (a) I lux = 0.1 lux. (b) I lux = 1 lux. (c) I lux = 10 lux. (d) I lux = 100 lux. (e) I lux = 1000 lux. (f) I lux = 10 000 lux.
|
Table 1. The parameters of the signal chain model in Fig. 2 .
|
Table 2. Different conditions for realistic QISs in Figs. 5 , 7 , and 8 .
|
Table 3. The correlation parameters of the QIS chip in Ref. [16 ].


Set citation alerts for the article
Please enter your email address

© Copyright 2018-2021 | Chinese Laser Press. All Rights Reserved 沪ICP备15018463号-20