• Laser & Optoelectronics Progress
  • Vol. 58, Issue 1, 114004 (2021)
Zhao Hui, Wang Haoyu, Zhu Siqi*, Yin Hao, Li Zhen, and Chen Zhenqiang
Author Affiliations
  • Department of Optoelectronic Engineering, Institute of Science and Technology, Jinan University, Guangzhou, Guangdong 510632, China
  • show less
    DOI: 10.3788/LOP202158.0114004 Cite this Article Set citation alerts
    Zhao Hui, Wang Haoyu, Zhu Siqi, Yin Hao, Li Zhen, Chen Zhenqiang. 578.5 nm End-Pumped Passively Q-switched Raman Yellow Laser[J]. Laser & Optoelectronics Progress, 2021, 58(1): 114004 Copy Citation Text show less
    Schematic diagram of the passively Q-switched Raman yellow laser
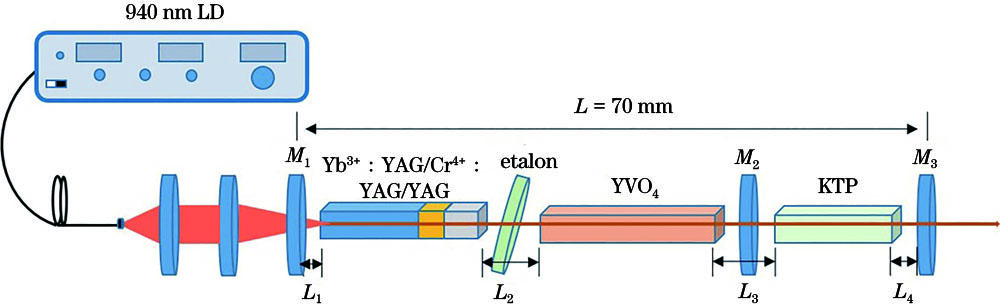
    Fig. 1. Schematic diagram of the passively Q-switched Raman yellow laser
    Variation curves of the output power with pump power at different transmittance TOC
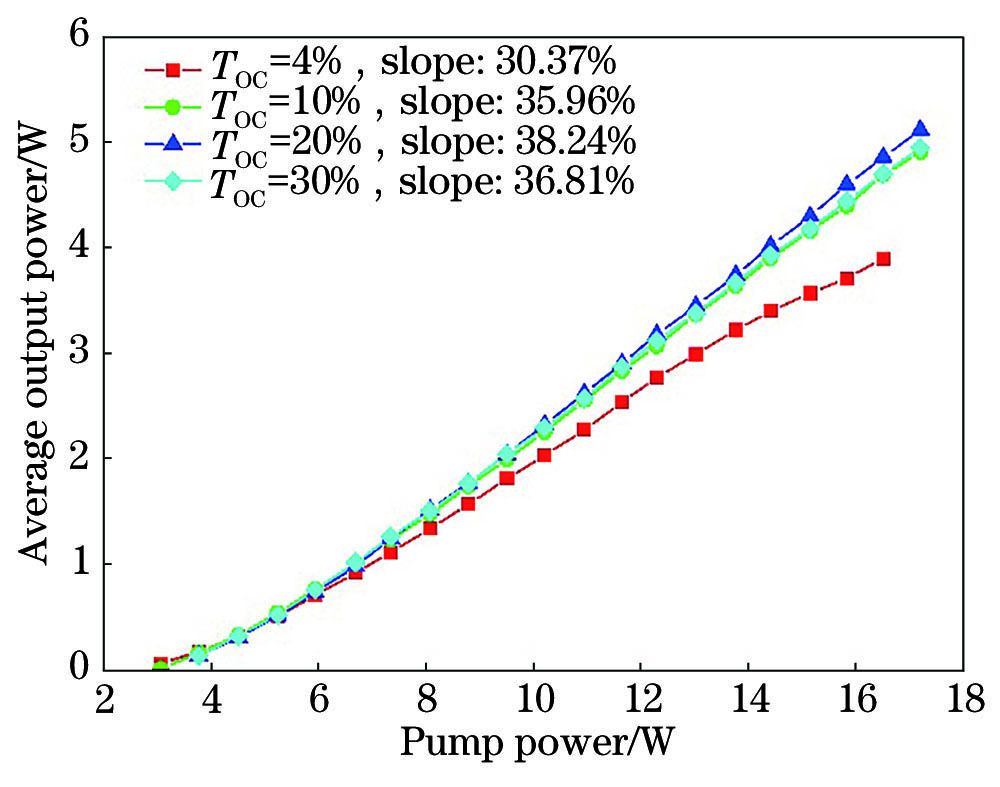
    Fig. 2. Variation curves of the output power with pump power at different transmittance TOC
    Variation curves of the pulse repetition frequency and pulse width with pump power at different transmittance TOC.(a)TOC=4%; (b)TOC=10%; (c)TOC=20%; (d)TOC=30%
    Fig. 3. Variation curves of the pulse repetition frequency and pulse width with pump power at different transmittance TOC.(a)TOC=4%; (b)TOC=10%; (c)TOC=20%; (d)TOC=30%
    Fundamental pulse image of the passively Q-switched laser at 1030 nm.
    Fig. 4. Fundamental pulse image of the passively Q-switched laser at 1030 nm.
    Relationship between dual-wavelength Raman optical power and pump power at different transmittance TOC. (a) TOC=5%; (b) TOC=10
    Fig. 5. Relationship between dual-wavelength Raman optical power and pump power at different transmittance TOC. (a) TOC=5%; (b) TOC=10
    Variation curves of the pulse repetition frequency and pulse width with pump power. (a) TOC=5%; (b) TOC=10%
    Fig. 6. Variation curves of the pulse repetition frequency and pulse width with pump power. (a) TOC=5%; (b) TOC=10%
    Variation curves of the pulse energy and peak power with pump power. (a) TOC=5%; (b) TOC=10%
    Fig. 7. Variation curves of the pulse energy and peak power with pump power. (a) TOC=5%; (b) TOC=10%
    Raman spectra of the output at different pump powers. (a) 4.30 W; (b) 6.69 W; (c) 8.79 W; (d) 10.95 W
    Fig. 8. Raman spectra of the output at different pump powers. (a) 4.30 W; (b) 6.69 W; (c) 8.79 W; (d) 10.95 W
    Pulse image of the output Raman laser
    Fig. 9. Pulse image of the output Raman laser
    Variation curve of the output power with pump power after adding the etalon
    Fig. 10. Variation curve of the output power with pump power after adding the etalon
    Variation curve of the Raman optical output characteristics with the pump power after adding the etalon. (a)Pulse repetition frequency and pulse width; (b) pulse energy and pulse peak power
    Fig. 11. Variation curve of the Raman optical output characteristics with the pump power after adding the etalon. (a)Pulse repetition frequency and pulse width; (b) pulse energy and pulse peak power
    Raman spectra of the different pump powers after adding etalon. (a) 4.50 W; (b) 5.94 W; (c) 8.79 W; (d) 10.21 W
    Fig. 12. Raman spectra of the different pump powers after adding etalon. (a) 4.50 W; (b) 5.94 W; (c) 8.79 W; (d) 10.21 W
    Pulse image of the Raman output laser after adding the etalon
    Fig. 13. Pulse image of the Raman output laser after adding the etalon
    Relationship between the average output power of 578.5 nm yellow light and the pump power
    Fig. 14. Relationship between the average output power of 578.5 nm yellow light and the pump power
    Variation curve of the output characteristics of 578.5 nm yellow light with the pump power. (a) Pulse repetition frequency and pulse width; (b) pulse energy and peak power
    Fig. 15. Variation curve of the output characteristics of 578.5 nm yellow light with the pump power. (a) Pulse repetition frequency and pulse width; (b) pulse energy and peak power
    Pulse diagram of the 578.5 nm yellow light output
    Fig. 16. Pulse diagram of the 578.5 nm yellow light output
    Yellow light spectrum when the pump power is 5.94 W
    Fig. 17. Yellow light spectrum when the pump power is 5.94 W
    Wavelength/nm10301135/1157578.5
    M1f=500 mm, S1:HT at 940 nm (T>99.75%), S2:AR at 940 nm, HR at 1029-1162 nm (R>99.8%)f=300 mm, HT at 940 nm (T>95%), HR at 1029-1162 nm (R>99.8%)f=300 mm, HT at 940 nm (T>95%), HR at 1029-1162 nm (R>99.8%)
    M2PR at 1030 nm, TOC=4%(f=300 mm) & 10%(plane)、20%(plane)、30%(plane)f=300 mm, S1:HR at 1029-1049 nm (R>99.8%), S2:PR at 1131-1162 nm (TOC=5% & 10%)plane mirror, HT at 1000-1200 nm (T>98%), HR at 520-600 nm (R>99.8%)
    M3//f=300 mm, HT at 940 nm & 561-592 nm
    Yb3+∶YAG/Cr4+∶YAG/YAGS1/S2:AR at 900-1200 nm (T>99%)
    YVO4S1/S2:AR at 1000-1400 nm (T>99%)
    KTPS1/S2:HT at 1157.5 nm & 578 nm
    Table 1. Lens and crystal (coating) parameters corresponding to different wavelength lasers
    Zhao Hui, Wang Haoyu, Zhu Siqi, Yin Hao, Li Zhen, Chen Zhenqiang. 578.5 nm End-Pumped Passively Q-switched Raman Yellow Laser[J]. Laser & Optoelectronics Progress, 2021, 58(1): 114004
    Download Citation