• Acta Optica Sinica
  • Vol. 44, Issue 4, 0400002 (2024)
Yanping Li, Yongqiang Chen, Yuqing Liu, Rui Hu, Junle Qu, and Liwei Liu*
Author Affiliations
  • College of Physics and Optoelectronic Engineering, Key Laboratory of Optoelectronic Devices and Systems of Guangdong Province and Ministry of Education, Shenzhen University, Shenzhen 518060, Guangdong , China
  • show less
    DOI: 10.3788/AOS231343 Cite this Article Set citation alerts
    Yanping Li, Yongqiang Chen, Yuqing Liu, Rui Hu, Junle Qu, Liwei Liu. Review on Multimodal Nonlinear Optical Microscopy Imaging Technology[J]. Acta Optica Sinica, 2024, 44(4): 0400002 Copy Citation Text show less
    Development history of nonlinear optical microscopes
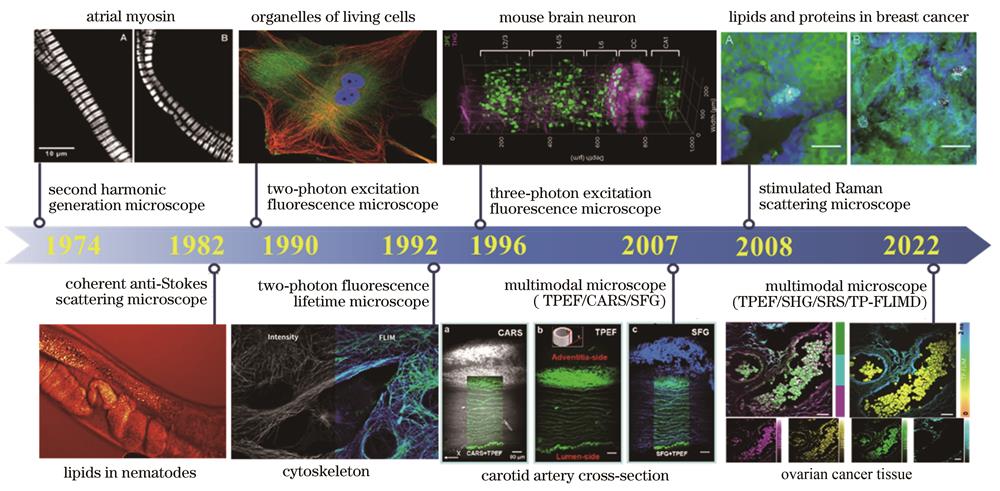
    Fig. 1. Development history of nonlinear optical microscopes
    Energy level diagrams of nonlinear effect. (a) Two photon excitation fluorescence; (b) three photon excitation fluorescence; (c) second harmonic generation; (d) third harmonic generation; (e) coherent anti-Stokes scattering; (f) stimulated Raman scattering
    Fig. 2. Energy level diagrams of nonlinear effect. (a) Two photon excitation fluorescence; (b) three photon excitation fluorescence; (c) second harmonic generation; (d) third harmonic generation; (e) coherent anti-Stokes scattering; (f) stimulated Raman scattering
    Multiphoton and second harmonic optical microscopy[54]. (a) Schematic diagram of optical system (AOM: acousto-optic modulator; GM: galvanometer; SL and TL: scan lens and tube lens; DM: dichroscope; M: reflector; MO: microscope objective; FL: focusing lens; F: filter; PMT: photomultiplier tube); (b) THG, SHG, and 2PEF signals of lung tumor tissue are detected by wavelength separation method with appropriate filters and merged into a THG/SHG/2PEF multi-modal image
    Fig. 3. Multiphoton and second harmonic optical microscopy[54]. (a) Schematic diagram of optical system (AOM: acousto-optic modulator; GM: galvanometer; SL and TL: scan lens and tube lens; DM: dichroscope; M: reflector; MO: microscope objective; FL: focusing lens; F: filter; PMT: photomultiplier tube); (b) THG, SHG, and 2PEF signals of lung tumor tissue are detected by wavelength separation method with appropriate filters and merged into a THG/SHG/2PEF multi-modal image
    Multimodal optical imaging microscopy is used to analyze the primary and metastatic tumor microenvironment[64]. (a) Schematic diagram of the optical imaging system based on MPEF/SHG/THG and single photon FLIM (AOM: acousto-optic modulator; IF: IR-cut filter; DM: dichroic mirror; PH: pin hole; HP: half-wave plate; FL: focal lens; FP: fiber port; PS: polarization splitter); (b) label-free imaging of metastatic tumors; (c) 3PEF image of NADH; (d) FLIM image; (e) SHG image of collagen; (f) TPEF image of FAD
    Fig. 4. Multimodal optical imaging microscopy is used to analyze the primary and metastatic tumor microenvironment[64]. (a) Schematic diagram of the optical imaging system based on MPEF/SHG/THG and single photon FLIM (AOM: acousto-optic modulator; IF: IR-cut filter; DM: dichroic mirror; PH: pin hole; HP: half-wave plate; FL: focal lens; FP: fiber port; PS: polarization splitter); (b) label-free imaging of metastatic tumors; (c) 3PEF image of NADH; (d) FLIM image; (e) SHG image of collagen; (f) TPEF image of FAD
    Multi-mode coupling of MPEF, SHG/THG, and CARS in nonlinear optical imaging systems. (a) Multimodal nonlinear optical imaging system that integrates TPEF, SHG, and CARS (PMT: photomultiplier)[81]; (b) multimodal nonlinear optical imaging system that integrates TPEF, 3PEF, SHG, THG, and CARS (SCG: supercontinuum generation; APS: arbitrary pulse shaping)[82]
    Fig. 5. Multi-mode coupling of MPEF, SHG/THG, and CARS in nonlinear optical imaging systems. (a) Multimodal nonlinear optical imaging system that integrates TPEF, SHG, and CARS (PMT: photomultiplier)[81]; (b) multimodal nonlinear optical imaging system that integrates TPEF, 3PEF, SHG, THG, and CARS (SCG: supercontinuum generation; APS: arbitrary pulse shaping)[82]
    Multi-parameter optical imaging system that integrates TPEF, SHG, SRS, and TP-FLIM[102]. (a) System schematic diagram(CO: condenser; DAQ: data acquisition system; DM: dichroic mirror; EOM: electro-optic modulator; GR: glass rod; λ/2: half-wave plate; OB: objective; PBS: polarizing beam splitter; PD: photodiode; λ/4: quarter-wave plate); (b) spatial resolution, (c) spectral resolution, and (d) temporal resolution of system
    Fig. 6. Multi-parameter optical imaging system that integrates TPEF, SHG, SRS, and TP-FLIM[102]. (a) System schematic diagram(CO: condenser; DAQ: data acquisition system; DM: dichroic mirror; EOM: electro-optic modulator; GR: glass rod; λ/2: half-wave plate; OB: objective; PBS: polarizing beam splitter; PD: photodiode; λ/4: quarter-wave plate); (b) spatial resolution, (c) spectral resolution, and (d) temporal resolution of system
    High throughput nonlinear optical imaging system based on high-speed scanner. (a) Schematic diagram of a nonlinear optical microscopy imaging system based on a polygonal scanner[112]; (b) schematic diagram of a nonlinear optical microscopy imaging system based on an acoustooptic deflector[113]; (c) schematic diagram of a three-dimensional nonlinear optical volume imaging system based on an acoustooptic deflector and a flow detection mirror[114]
    Fig. 7. High throughput nonlinear optical imaging system based on high-speed scanner. (a) Schematic diagram of a nonlinear optical microscopy imaging system based on a polygonal scanner[112]; (b) schematic diagram of a nonlinear optical microscopy imaging system based on an acoustooptic deflector[113]; (c) schematic diagram of a three-dimensional nonlinear optical volume imaging system based on an acoustooptic deflector and a flow detection mirror[114]
    Scanning mechanism of a nonlinear optical endoscope[181]. (a) Near end scanning combined with fiber bundle conduction; (b) optical fiber tip scanning is achieved through mechanical resonance of piezoelectric actuators; (c) MEMS systems are used for remote scanning
    Fig. 8. Scanning mechanism of a nonlinear optical endoscope[181]. (a) Near end scanning combined with fiber bundle conduction; (b) optical fiber tip scanning is achieved through mechanical resonance of piezoelectric actuators; (c) MEMS systems are used for remote scanning
    Several common multi-parameter nonlinear endoscopic imaging systems. (a) Near-end scanning multimodal optical endoscope based on fiber bundles and multimode fibers[170]; (b) remote scanning multimodal optical endoscope based on hollow photonic crystal double clad fiber and piezoelectric actuator[131]; (c) multimodal nonlinear optical endoscopic imaging system based on dual core double clad fiber and micro focusing objective[167]
    Fig. 9. Several common multi-parameter nonlinear endoscopic imaging systems. (a) Near-end scanning multimodal optical endoscope based on fiber bundles and multimode fibers[170]; (b) remote scanning multimodal optical endoscope based on hollow photonic crystal double clad fiber and piezoelectric actuator[131]; (c) multimodal nonlinear optical endoscopic imaging system based on dual core double clad fiber and micro focusing objective[167]
    TPEF and SHG image analysis methods
    Fig. 10. TPEF and SHG image analysis methods
    TPEF and SHG images of normal ovarian (A, D, G, J) and ovarian cancer (B, E, H, K) tissues,and SAAID index (C), TACS statistics (F), anisotropic histogram (I), and spatial correlation curves (L) of normal ovarian and ovarian cancer tissues[185]
    Fig. 11. TPEF and SHG images of normal ovarian (A, D, G, J) and ovarian cancer (B, E, H, K) tissues,and SAAID index (C), TACS statistics (F), anisotropic histogram (I), and spatial correlation curves (L) of normal ovarian and ovarian cancer tissues[185]
    Multivariate curve resolution for SRS image analysis
    Fig. 12. Multivariate curve resolution for SRS image analysis
    TP-FLIM phasor diagram analysis
    Fig. 13. TP-FLIM phasor diagram analysis
    Single component and multi-component fluorescence lifetime phasor plots[197]. (a) Single component; (b) multi-component
    Fig. 14. Single component and multi-component fluorescence lifetime phasor plots[197]. (a) Single component; (b) multi-component
    Imaging modalityTPEF3PEFSHGTHGCARSSRSFLIM
    Electric susceptibilityχ3χ5χ2χ3χ3χ3
    Year of discovery1961196719611962196519621989
    First application199031996519741199753198222008719924
    Contrast mechanism

    Two-

    photon simultaneous absorption

    Three-

    photon simultaneous absorption

    Non-centrosymmetric structureStructures with significant changes in refractive index or third-order magnetic susceptibilityMolecular vibrationConformation of fluorescent molecules and their environment
    Typical applicationsNADH,FAD,etc.Structural protein array,collagen fibers,etc.Liposomes,adipose tissue,etc.Biomolecules such as lipids and proteinsPH,viscosity,temperature,ion concentration,etc.
    FeaturesHigh resolution,3D tomography capability,large imaging depth,qualitative analysis of specific moleculesHigh sensitivity,high signal-to-noise ratio,and no involvement in light absorption,without thermal damage and photobleachingHigh sensitivity,high specificity,spectral resolution,but complex imaging systemNot affected by fluorescence concentration,photobleaching,and excitation light intensity,with quantitative analysis ability
    Table 1. Characteristics of nonlinear optical microscopes
    Yanping Li, Yongqiang Chen, Yuqing Liu, Rui Hu, Junle Qu, Liwei Liu. Review on Multimodal Nonlinear Optical Microscopy Imaging Technology[J]. Acta Optica Sinica, 2024, 44(4): 0400002
    Download Citation