• Laser & Optoelectronics Progress
  • Vol. 59, Issue 13, 1323002 (2022)
Yining Liu, Weili Fan*, Xiaohan Hou, Zhicheng Wu, Yafeng He, and Fucheng Liu**
Author Affiliations
  • College of Physics Science and Technology, Hebei University, Baoding 071002, Hebei , China
  • show less
    DOI: 10.3788/LOP202259.1323002 Cite this Article Set citation alerts
    Yining Liu, Weili Fan, Xiaohan Hou, Zhicheng Wu, Yafeng He, Fucheng Liu. Annular Plasma Photonic Crystals with Different Filling Ratios in Dielectric Barrier Discharge[J]. Laser & Optoelectronics Progress, 2022, 59(13): 1323002 Copy Citation Text show less
    Experimental setup of APPCs formation using dielectric barrier discharge system with two water electrodes. (a) Schematic diagram of experimental setup; (b) picture from realdevice; (c) schematic diagram of APPCs formation
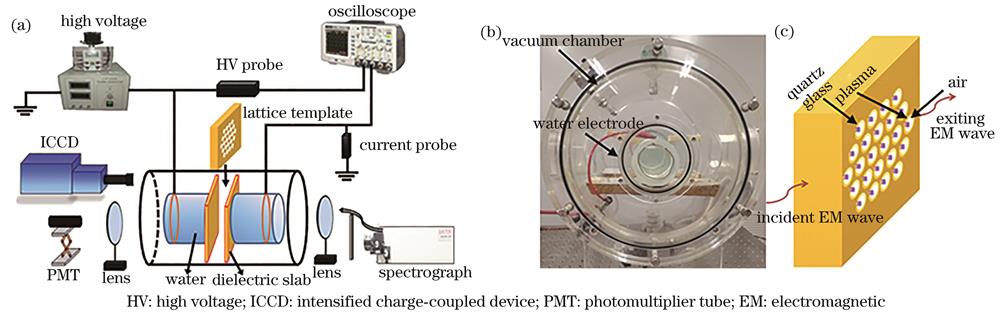
    Fig. 1. Experimental setup of APPCs formation using dielectric barrier discharge system with two water electrodes. (a) Schematic diagram of experimental setup; (b) picture from realdevice; (c) schematic diagram of APPCs formation
    Reconfiguration of APPCs with different filling ratios by varying supply voltage and gas pressures. (a1),(b1),(c1) Snapshots of APPCs obtained in experiment; (a2),(b2),(c2) schematic diagrams of APPCs, in which circular areas in center denote plasma columns, white rings denote air and backgrounds represent quartz glass; (a3),(b3),(c3) light intensity distribution of plasmas in each annular cell. Experimental parameters: (a1) U=3.2 kV,P=25.3 kPa; (b1) U=3.0 kV, P=25.3 kPa; (c1) U=2.6 kV, P=20.3 kPa. Ratio of working gas Air∶Ar=2∶1, frequency of supply voltage f=48.5 kHz
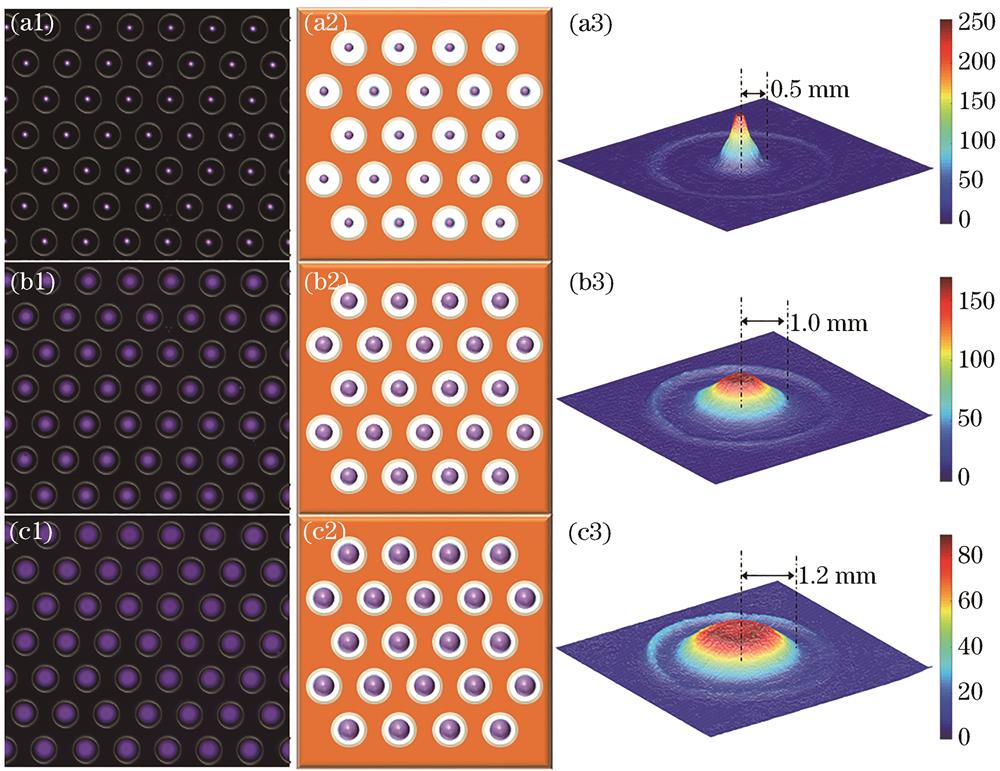
    Fig. 2. Reconfiguration of APPCs with different filling ratios by varying supply voltage and gas pressures. (a1),(b1),(c1) Snapshots of APPCs obtained in experiment; (a2),(b2),(c2) schematic diagrams of APPCs, in which circular areas in center denote plasma columns, white rings denote air and backgrounds represent quartz glass; (a3),(b3),(c3) light intensity distribution of plasmas in each annular cell. Experimental parameters: (a1) U=3.2 kV,P=25.3 kPa; (b1) U=3.0 kV, P=25.3 kPa; (c1) U=2.6 kV, P=20.3 kPa. Ratio of working gas Air∶Ar=2∶1, frequency of supply voltage f=48.5 kHz
    Spatio-temporally resolved measurements of discharge of APPCs with different filling ratios. (a1), (b1), (c1) Oscillogram of discharge current I, supply voltage U and light signal of one single filament A, closeups of singlecurrent pulses, denoted by strips in current waveforms, are presented in middle column; (a2), (b2), (c2) instantaneous images of discharges occurring during one single current pulse, obtained using fast camera diagnostics. Images are integrated over 30 voltage cycles to improve brightness and clarity
    Fig. 3. Spatio-temporally resolved measurements of discharge of APPCs with different filling ratios. (a1), (b1), (c1) Oscillogram of discharge current I, supply voltage U and light signal of one single filament A, closeups of singlecurrent pulses, denoted by strips in current waveforms, are presented in middle column; (a2), (b2), (c2) instantaneous images of discharges occurring during one single current pulse, obtained using fast camera diagnostics. Images are integrated over 30 voltage cycles to improve brightness and clarity
    Schematic diagram of APPCs. (a) Lattice diagram, in which a1⃗ and a2⃗ are lattice vectors of triangular lattices; (b) irreducible Brillouin zone; (c) schematic diagram of primitive cell, in which r0 denotes radius of air ring and r1 denotes radius of central plasma column
    Fig. 4. Schematic diagram of APPCs. (a) Lattice diagram, in which a1 and a2 are lattice vectors of triangular lattices; (b) irreducible Brillouin zone; (c) schematic diagram of primitive cell, in which r0 denotes radius of air ring and r1 denotes radius of central plasma column
    Diagrams of band structures of APPCs with different filling ratios of plasmas. (a)~(d) Radii of plasma columns are 0.5, 1.0, 1.2, 1.5 mm, respectively. Structures in (a)~(c) are accordance with APPCs obtained in experiment as shown in Fig. 2(a1)~2(c1). Gray stripes and dark stripes denote unidirectional and omnidirectional band gaps, respectively
    Fig. 5. Diagrams of band structures of APPCs with different filling ratios of plasmas. (a)~(d) Radii of plasma columns are 0.5, 1.0, 1.2, 1.5 mm, respectively. Structures in (a)~(c) are accordance with APPCs obtained in experiment as shown in Fig. 2(a1)~2(c1). Gray stripes and dark stripes denote unidirectional and omnidirectional band gaps, respectively
    Variation of the first and second band gaps with increase of plasma column radius R for APPCs and conventional triangular PPCs. APPC PBG1, APPC PBG2 denote the first and second omnidirectional band gaps for APPCs, and PPC PBG1, PPC PBG2 represent the first and second omnidirectional band gaps for conventional triangular PPCs
    Fig. 6. Variation of the first and second band gaps with increase of plasma column radius R for APPCs and conventional triangular PPCs. APPC PBG1, APPC PBG2 denote the first and second omnidirectional band gaps for APPCs, and PPC PBG1, PPC PBG2 represent the first and second omnidirectional band gaps for conventional triangular PPCs
    Yining Liu, Weili Fan, Xiaohan Hou, Zhicheng Wu, Yafeng He, Fucheng Liu. Annular Plasma Photonic Crystals with Different Filling Ratios in Dielectric Barrier Discharge[J]. Laser & Optoelectronics Progress, 2022, 59(13): 1323002
    Download Citation