
Jianan Duan, Heming Huang, Bozhang Dong, Justin C. Norman, Zeyu Zhang, John E. Bowers, Frédéric Grillot, "Dynamic and nonlinear properties of epitaxial quantum dot lasers on silicon for isolator-free integration," Photonics Res. 7, 1222 (2019)
- Photonics Research
- Vol. 7, Issue 11, 1222 (2019)
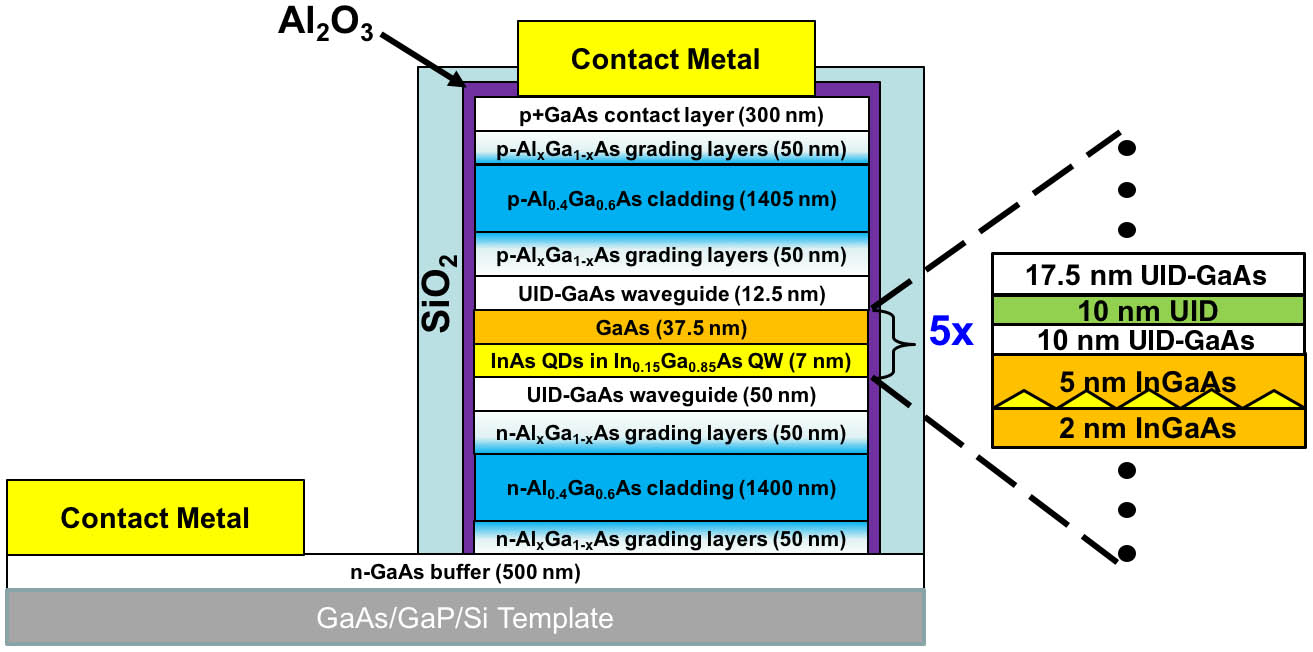
Fig. 1. Schematic illustration of the laser epitaxial structure; the close-up on the right depicts one period of the active region.
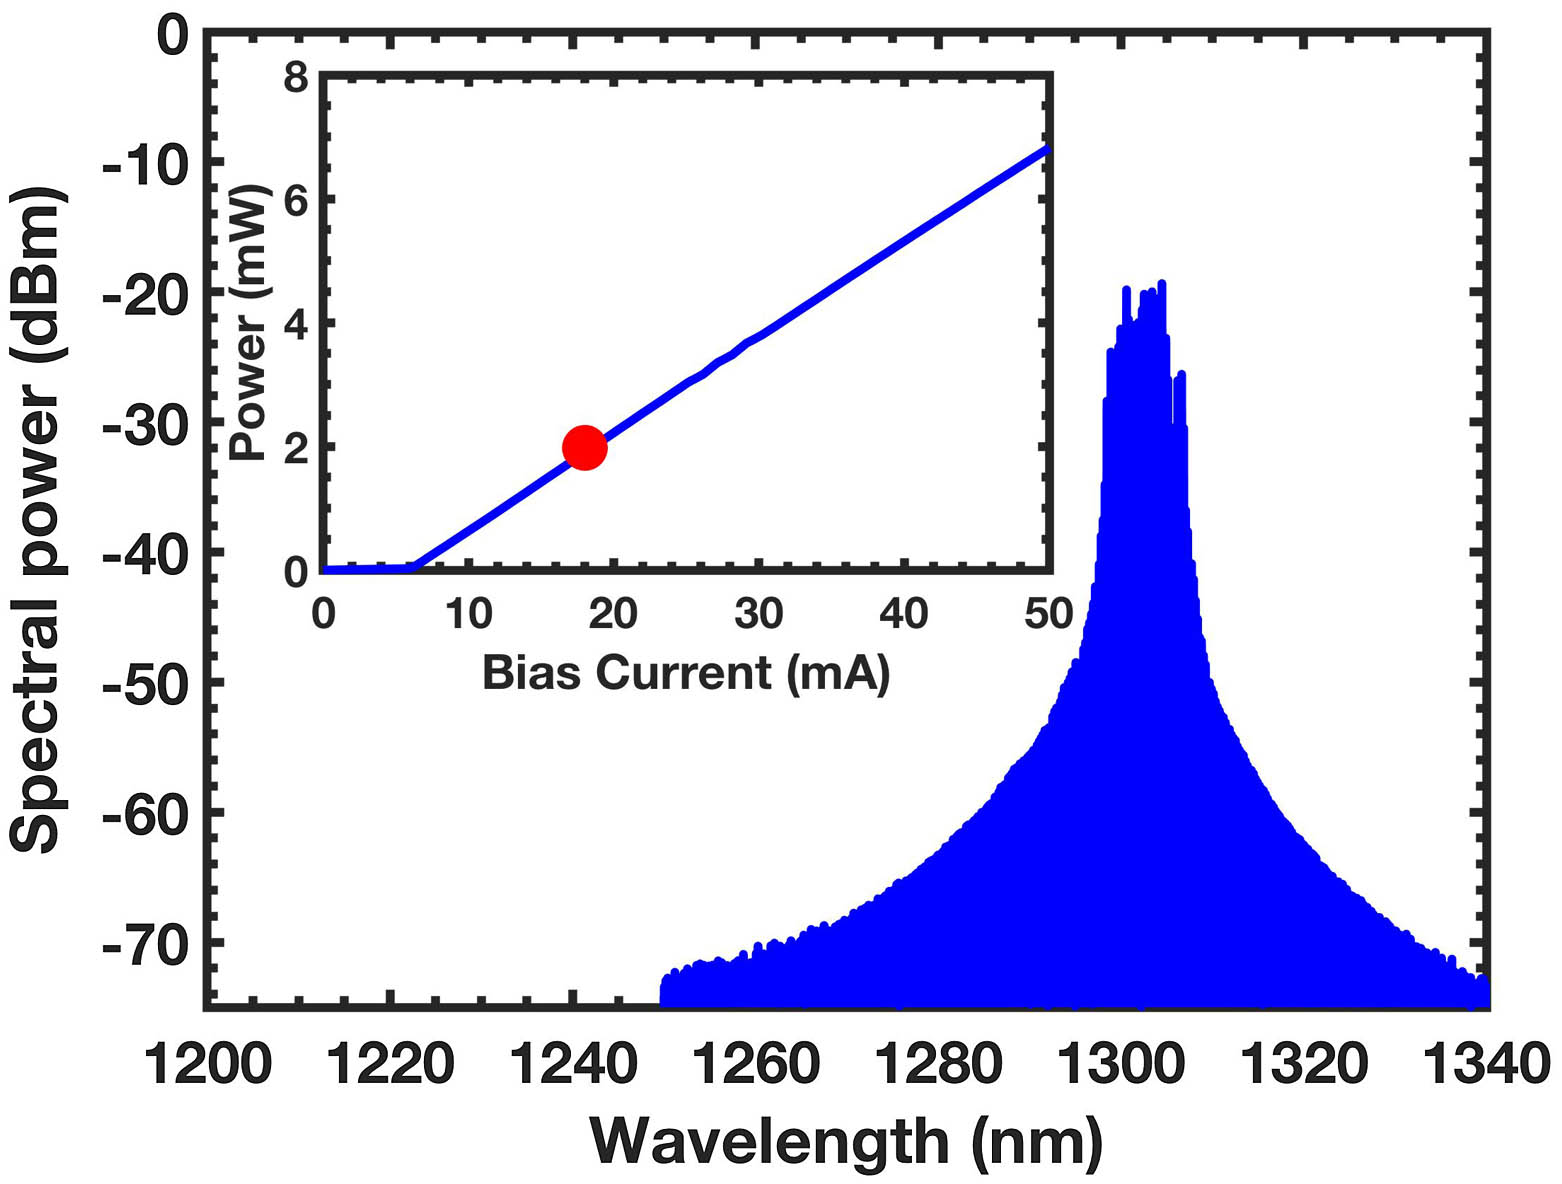
Fig. 2. Optical spectrum at 18 mA (3 × I th
Fig. 3. Measured optical spectra for the QD laser. In black, the free-running laser without optical injection. In blue, the laser is injection-locked. When the wavelength detuning is increased by 11 pm, the blue lines are shifted towards the red lines.
Fig. 4. Spectral dependence of the α H α H α H
Fig. 5. Measured damping factor (γ f RO 2
Fig. 6. Squared relaxation oscillation frequency (f RO 2
Fig. 7. The simulated α H
Fig. 8. Schematic of the optical feedback apparatus used both for static and dynamic characterizations.
Fig. 9. Optical spectra under free-running (blue) and 100% (red) of total reflection for QD laser at (a) 3 × I th 4 × I th
Fig. 10. (a) BER curves for solitary QD laser and with 100% of backreflection in B2B configuration and after transmission. Eye diagrams (b) of the solitary laser and (c) with 100% feedback in B2B configuration. Eye diagrams (d) of the solitary laser and (e) with 100% feedback after transmission.
|
Table 1. Dynamical Parameters of QD and QW Lasers


Set citation alerts for the article
Please enter your email address

© Copyright 2018-2021 | Chinese Laser Press. All Rights Reserved 沪ICP备15018463号-20