Abstract
This work investigates the dynamic and nonlinear properties of quantum dot (QD) lasers directly grown on silicon with a view to isolator-free applications. Among them, the chirp parameter, also named the factor, is featured through a thermally insensitive method analyzing the residual side-mode dynamics under optical injection locking. The at threshold is found as low as 0.32. Then, the nonlinear gain is investigated from the gain compression factor viewpoint. The latter is found higher for epitaxial QD lasers on silicon than that in heterogeneously integrated quantum well (QW) devices on silicon. Despite that, the power dependence of the does not lead to a large increase of the chirp coefficient above the laser’s threshold at higher bias. This effect is confirmed from an analytical model and attributed to the strong lasing emission of the ground-state transition, which transforms into a critical feedback level as high as , which is higher than a comparable QW laser. Finally, the intensity noise analysis confirms that QD lasers are overdamped oscillators with damping frequencies as large as 33 GHz. Altogether, these features contribute to fundamentally enhancing the reflection insensitivity of the epitaxial QD lasers. This last feature is unveiled by the 10 Gbit/s error-free high-speed transmission experiments. Overall, we believe that this work is of paramount importance for future isolator-free photonics technologies and cost-efficient high-speed transmission systems.1. INTRODUCTION
Development of on-chip photonic integration brings many innovative perspectives, in particular, deployable gas and biomolecular sensing systems, compact laser-based radars for self-driving automobiles, as well as energy-efficient interconnects for datacom and telecom [1,2]. The building blocks that are available in the silicon photonic platform allow for the integration of a vast array of functionalities in a single circuit [3]. However, each additional on-chip component can produce a possible source for reflections to any on-chip laser, hence requiring the inclusion of an optical isolator [4]. Without this device, the integrated lasers cannot be protected from reflections by completely suppressing the optical feedback. Integrated isolators are usually classified into three categories: those based on nonlinear effects; those based on spatiotemporal modulation; and those based on magneto-optic effects [5]. However, up to now, no integrated isolator has been demonstrated that provides strong isolation and negligible insertion loss, hence rendering the demonstration of feedback-insensitive lasers of paramount importance.
The chirp parameter, also called the factor, is a crucial parameter resulting from the phase-amplitude coupling effect. The relation between the factor and the frequency chirp () can be expressed as where is the output power, is the modal confinement factor, is the gain compression factor, is the active layer volume, is the energy per photon, and is the total differential quantum efficiency. As shown in Eq. (1), a larger factor often results in a frequency chirp () under direct modulation, which typically limits the maximum data rate and transmission distance over a dispersive fiber [6,7]. In addition, the factor of semiconductor lasers also determines the spectral linewidth [8], the four-wave mixing generation [9], the nonlinear dynamics under optical injection [10], as well as the reflection sensitivity [11–13]. Compared with quantum well (QW) lasers, quantum dot (QD) lasers directly grown on silicon have recently shown numerous advantages in terms of performance owing to their atom-like density of states [14]. For instance, our initial work demonstrated an factor as low as 0.29 in epitaxial QD lasers on silicon, which was further reduced to 0.13 with hole doping [15]. This result was obtained from the amplified spontaneous emission (ASE), extracting the net modal gain change and longitudinal mode wavelength shift with the variation of the subthreshold current [15]. However, although this method has been used for years, it is known that it can possibly underestimate its value when thermal effects are not properly eliminated [16,17]. In this paper, we attempt to feature the factor of epitaxial QD lasers on silicon with a thermally insensitive method that relies on the evaluation of the gain and wavelength changes of the suppressed side modes by optical injection locking. Given that the method is thermally insensitive, the results show values of as low as 0.32, resulting from the low threading dislocation density and high material gain of the active region. Therefore, such results also confirm our initial measurements conducted with the ASE [15]. Apart from the factor, other dynamical and nonlinear features such as damping factor, relaxation frequency, and gain compression are also visited because of their strong importance for high-speed and reflection insensitivity performance [18]. From the intensity noise spectrum, both the relaxation frequency and the damping factor as well as, subsequently, the gain compression are extracted [19]. Thus, the influence of the nonlinear gain on the above-threshold factor is investigated. To this end, an analytical model is employed in order to qualitatively explain the power dependence of the factor. Simulations show that the chirp coefficient does not increase that much above-threshold, which is also in relatively good agreement with our prior measurements [15]. Together the low factor with the damping factor, which is found as large as 33 GHz, contributes to improving the optical feedback insensitivity of epitaxial QD lasers, which is enhanced by over that from a heterogeneously integrated QW laser on silicon. These findings are also consistent with the high-speed transmission experiments, where no errors are detected even under strong optical feedback with 100% of backreflection, demonstrating that such lasers are very promising for future integrated technologies operating without optical isolators.
2. LASER DESCRIPTION
As shown in Fig. 1, the InAs/GaAs Fabry–Perot (FP) laser epistructure consists of five QD layers directly grown on an on-axis (001) Si wafer in a Veeco Gen-II molecular beam epitaxy chamber and spaced by 37.5 nm thick GaAs barrier layers [20]. The laser is 1.1 mm long with a 3.5 μm wide ridge waveguide. Asymmetric facet coatings are applied with the output facet having 55% power reflectivity, while the rear facet has a value of 99%. Figure 2 displays multimode lasing spectra for the QD laser at 18 mA bias emitting on the ground-state (GS) transition. The inset displays the corresponding light-current curve, with threshold current as low as 6 mA at room temperature (20°C). It is noted that the excited state (ES) is not visible unless the laser is biased at a very high current (beyond ). Such a large ES-to-GS lasing threshold ratio is a peculiar feature of QDs governing the laser stability under optical feedback. When this ratio is small, fast switching dynamics with respect to the bias current occurs, meaning that the reflection tolerance is greatly degraded [21]. In comparison with QD lasers, a heterogeneously integrated QW laser has been also investigated that has seven compressively strained InAlGaAs QWs as the active region and lasing around 1580 nm; other structure details can be found in Ref. [22].
Sign up for Photonics Research TOC. Get the latest issue of Photonics Research delivered right to you!Sign up now
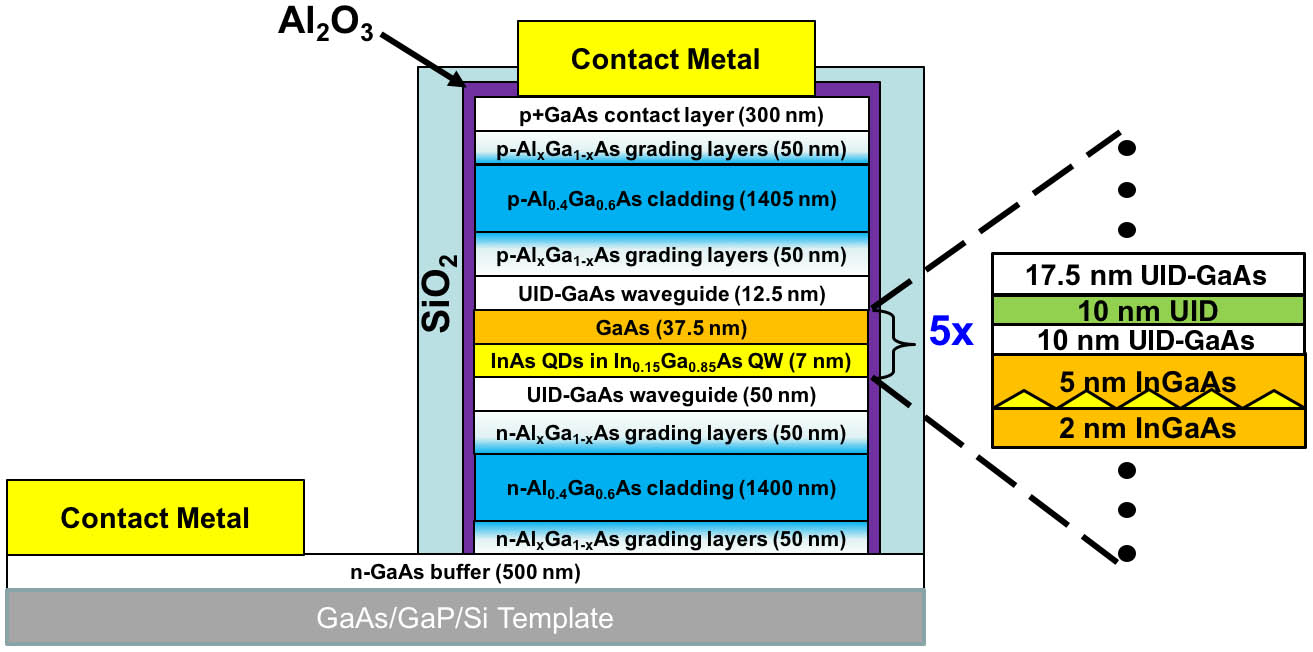
Figure 1.Schematic illustration of the laser epitaxial structure; the close-up on the right depicts one period of the active region.

Figure 2.Optical spectrum at 18 mA (, red marker) of the QD laser. The inset shows the light-current characteristics measured at room temperature (20°C).
Furthermore, the critical feedback level () of a semiconductor laser is defined as the critical ratio between the returned power and the free-space emitted power at the coupling facet. The critical feedback level gives the maximum feedback ratio that can be tolerated into a communication system for maintaining a floor-free operation. The critical feedback level is expressed as [23] where is the cavity round-trip time, and is the coupling coefficient of the laser’s front facet with facet reflectivity coupled to the external cavity. From Eq. (2), it is clear that the critical feedback level strongly depends on the damping factor () and factor, but also on the geometry of the laser cavity through the cavity photon round-trip time and facet reflectivity, the latter controlling the amount of light coupled to the external world. Let us also stress that Eq. (2) was shown to be the analytical form of the critical feedback level that most approximates the exact solution of the well-known Lang–Kobayashi rate equation without any limitation on the feedback intensity and the factor [23].
3. SUBTHRESHOLD αH FACTOR DETERMINATION
From the ASE method, the factor describing the coupling between the carrier-induced variation of real and imaginary parts of susceptibility is expressed as follows [17]: where is the cavity length, and is the free spectral range. The ASE method depends on obtaining the differential gain by measuring the net modal gain from the longitudinal FP modulation depth, while the differential index is measured by monitoring the wavelength shift of the FP modes. However, because the change of mode wavelength and the net modal gain require a variation of the bias current , persistent device heating usually results in a possible underestimation of the factor. One straightforward method relies on using bias current with continuous-wave operation and eliminating the thermal effects through the inclusion of a thermal correction in Eq. (3). Following this protocol, the thermal effect-induced wavelength redshift when varying the bias current right above threshold can be subtracted from the wavelength blueshift measured below threshold. This method can certainly minimize the fitting error theoretically when the thermal correction works under the two assumptions: first, that thermal effects in QD lasers must maintain unchanged below and above threshold; second, the carriers are clamped above threshold. However, in reality, it is hard to realize this for QD lasers, as the carrier population in resonant states keeps increasing with the bias currents, which will continue to enhance the gain and change the refractive index. In order to eliminate the thermal effects, a current source operating in a pulsed mode is usually preferred as opposed to the continuous wave [15]. In what follows, the laser is biased with a pulsed current using the shortest pulse width of 100 ns. For each subthreshold bias current, the peak wavelength is measured by varying the duty cycle from 0.1% to 10% with a step of 2%, and the curve-fit extrapolation at zero duty cycle allows determining the corresponding values without thermal effects. Nevertheless, operating the laser under pulsed current is not always possible because of the low signal-to-noise ratio and irregular spectral line shape.
Another way to determine the factor relies on the analysis of the residual side-mode dynamics under optical injection [16]. Figure 3 illustrates the effect of the optical injection, which involves a master-laser-slave-laser coupling. The master is a single-mode laser with a narrow spectral linewidth () that is injected into the slave laser. Under proper injection conditions, the slave laser can be locked by the master and emits on the locked lasing mode, as shown in Fig. 3, where optical injection into the FP modes (black lines) is performed far from the gain peak (here at 1320 nm) and right above the threshold (at 6.2 mA). In such a case, the laser operates in the stable locking regime, meaning that only the mode subject to the optical injection is locked at 1320 nm while the others are deeply suppressed (blue lines). In addition, as optical injection reduces the gain, Fig. 3 shows that the side modes can even be more suppressed (red lines) when the wavelength detuning between the master and the slave lasers is enhanced. In this way, the residual power of the side modes falls into the ASE, and therefore the factor can be extracted in the operating window close to the gain peak. Hence, this is the reason why the method is called ASE-IL. As this gain reduction is similar to that induced by the bias current in the ASE method, Eq. (3) can be recast as follows [16]: with the injection wavelength of the master laser. Consequently, as aforementioned, an enhancement of the wavelength detuning shifts the lasing mode towards the longer wavelength side and reduces the gain to a lower level.
Figure 3.Measured optical spectra for the QD laser. In black, the free-running laser without optical injection. In blue, the laser is injection-locked. When the wavelength detuning is increased by 11 pm, the blue lines are shifted towards the red lines.
Figure 4 shows the spectral dependence of the factor of the QD laser measured by the ASE and ASE-IL methods. The values extracted by ASE-IL are in a very good agreement with those from the standard ASE. The increases from about 0.24 at 1297 nm to 0.48 at 1305 nm, whereas the value at the gain peak equals 0.32. Interestingly, the is found to be a bit higher than that of the ASE method, which is directly the consequence of the fixed bias current used in the ASE-IL, while the ASE requires a variation of the bias current, leading to persistent device heating and underestimation of the factor. As a comparison, the inset also presents the measured factor of a heterogeneously integrated QW laser on silicon. Within the spectral range of 1570–1580 nm, the -factor values measured under ASE-IL are also very consistent with the ASE values, showing that this method is perfectly reliable and compatible with any type of semiconductor laser. For the heterogeneously integrated QW laser on silicon, the value at the gain peak equals 3.50, which is much larger than that of the epitaxial QD lasers. This is expected for a two-dimensional heterostructure as opposed to semiconductor atoms with zero dimensionality.
Figure 4.Spectral dependence of the factor measured by ASE (blue) and ASE-IL methods (red) for the epitaxial QD laser. The inset shows the -factor values for the QW laser. The vertical dotted line indicates the -factor value at FP gain peak.
4. DYNAMICAL PROPERTIES
Apart from the factor, the damping factor () and the relaxation oscillation frequency () both play a key role in the high-speed performance and in the response to optical feedback. In what follows, those dynamical parameters are extracted from the relative intensity noise for different bias conditions (not shown here). Thus, Fig. 5 depicts the comparison of the measured damping factor as a function of squared relaxation frequency between the QD and QW lasers. In both cases, the evolution is linear following the relationship , with the slope and the inverse of the differential carrier lifetime. As QD lasers behave as quasi-class-A oscillators, the damping factor rises quickly; hence, the value is found as large as 33 GHz at with a K factor of 4.7 ns. Conversely, the damping factor for QW laser increases smoothly up to only 15 GHz at . In Fig. 6, the square of the measured resonance frequency is plotted as a function of the output power for QD and QW lasers. The relaxation oscillation frequency is proportional to the square root of the optical output power; hence, the curve fitting to be used is based on the following expression [24,25]: where denotes the gain compression coefficient related to the output power , indicating that for this pumping level, nonlinear effects start to be significant. is the modulation efficiency and can be approximated by the initial slope of the curves. By curve-fitting the curves, the gain compression factor is found at for the QD laser, which is larger than that of the QW laser for which the gain compression is . The gain compression factor linked to photon density () can then be expressed through the relationship: , where , is the cavity volume and is the energy loss through the mirrors. Taking into account the facet reflectivity and the modal volume of the laser, is calculated with a value of for the QD laser against for the QW one. Those values are in agreement with prior works already published in the literature [23–25]. All dynamical parameters have been summarized in Table 1.
Figure 5.Measured damping factor () as a function of the squared relaxation oscillation frequency (), both for QD and QW lasers.
Figure 6.Squared relaxation oscillation frequency () versus the output power, both for QD and QW lasers.
| Parameters | QW | QD |
| αH | 3.50 | 0.32 |
| K (ns) | 0.9 | 4.7 |
| γ0 (GHz) | 3.4 | 1.5 |
| ϵP (mW−1) | 0.07 | 0.15 |
| ϵS (cm3) | 3.3×10⁻¹⁷ | 5.7×10⁻¹⁶ |
| fcrit (dB) | −25.5 | −6.5 |
Table 1. Dynamical Parameters of QD and QW Lasers
5. ABOVE-THRESHOLD αH FACTOR DETERMINATION
In semiconductor lasers, the differential gain affected by the gain compression effect can be written according to the relationship where is uncompressed differential gain. Therefore, by inserting Eq. (6) into Eq. (3), the power dependence of the directly results from the decrease of the differential gain through the gain compression and can be qualitatively approximated by the relationship where describes the factor at threshold. Equation (7) stands for a QW laser for which remains constant above threshold because the carrier density is clamped. Thus, Fig. 7(a) shows the calculated of the QW laser considering that the measured threshold value of is 3.50. As shown, the linearly increases over the range of the output power. However, as compared to QW lasers, the carrier density at the GS is not clamped in QD lasers due to the inhomogeneous gain broadening [26]. In addition, the carrier filling in the ES contributes to increasing the of the GS transition, resulting in an additional dependence with the output power. Taking into account all these considerations, it was shown that Eq. (7) can be reformulated in the case of QD lasers as [24] where represents the change of GS index caused by GS gain variation, while is that induced by ES gain variation. These two coefficients are used as fitting parameters in the simulations. Given that the maximum gain is and that the gain at threshold is [27], Fig. 7(b) shows the calculated power dependence of the factor (blue dots) for the QD laser. The black star markers correspond to experimental data taken from Ref. [15], which have shown that the increases smoothly above the laser’s threshold. Therefore, the simulation results qualitatively agree with the measurements, indicating that the power dependence of the factor is essentially ruled out by the gain compression and the carrier filling from the ES. However, according to Fig. 7(b), the star marks do not quantitatively agree with the simulation results. This discrepancy can be mostly explained by the model itself, which does not take into account all the peculiar properties of the QDs (e.g., inhomogeneous broadenings, multiple higher energy levels, etc.). Although the agreement is qualitative rather than quantitative, it does reflect the right trend of the pump current dependence of the factor. Despite the large gain compression coefficient, Fig. 7(b) shows that the increase of the remains pretty linear until the output power reaches about 4 mW. This effect is attributed to the fact that the switching dynamics towards the ES takes place at a very large bias, meaning that the second member of the right-hand side of Eq. (8) does not impact the power dependence of the that much. This situation is fundamentally different when both gain compression and switching dynamics from GS to ES take place [24]. Thus, from Eqs. (7) and (8), it turns out that the of the QW laser increases to 4 at , while for the epitaxial lasers it is constrained to about 2 under the same bias conditions. Considering the value of the damping factors aforementioned, of the QD laser is found not exceeding , which is larger than that of the QW laser. These values are also reported in Table 1.
Figure 7.The simulated factor as a function of the output power for the (a) QW laser and (b) QD laser. Superimposed black stars in (b) correspond to experimental data from Ref. [15].
6. REFLECTION SENSITIVITY
In order to confirm the calculation, the optical feedback experiment is also performed. Figure 8 depicts schematically the optical feedback apparatus employed in this work. The emission is coupled by an antireflection (AR)-coated fiber, and 90% is sent to a backreflector (BKR) consisting of a variable attenuator and a mirror. The forming external cavity is 7 m in length, with a 14 MHz fundamental frequency. The BKR is also used to continuously vary the feedback strength from to . In the communication system, the feedback is often depicted using the reflection from the fiber end back to the laser source; hence, 100% feedback is defined as the amount of reflected power with the ratio to the total backreflection (TBR), which is equal to (maximum feedback level) in the measurements [28]. The other 10% of the coupled power is isolated and amplified by a semiconductor optical amplifier (SOA). Then, another 90/10 coupler is inserted to split 10% of the amplified power from the fed-back laser for monitoring and spectral analysis. The remaining 90% is modulated with a Mach–Zehnder modulator (MZM) at 10 GHz (on-off keying) with a pseudo-random binary sequence (PRBS) and a bit sequence length of . Afterwards, the modulated signal is preamplified and transmitted through a 2 km single-mode fiber (SMF). At the end, a variable optical attenuator (VOA) is used to tune the received power of the error detector in order to characterize the bit error rate (BER) performance. A high-speed oscilloscope (OSC) is used to capture the eye diagram. Figure 9 shows the optical spectra under free-running (blue) and 100% (red) of TBR at and . As shown for both cases, the laser remains perfectly stable, even under strong optical feedback for which no sign of mode hopping and spectral broadening is observed. Since the laser is stable under optical feedback both at and , the high-speed measurement is only performed on the laser biased at . Figure 10(a) compares the BER with and without optical feedback under 10 Gbit/s external modulation for the back-to-back (B2B) and after 2 km fiber transmission. As shown, whatever the configurations, BER plots between the free-running and the case for the highest feedback level overlap both, implying an excellent stability of the QD laser without any performance degradation. Figures 10(b)–10(e) demonstrate that the reflection insensitivity is also confirmed by the eye diagram, which keeps open for B2B and after transmission with optical feedback. On the other hand, after transmission, a power penalty of 2.5 dB is obtained at BER level. Such discrepancy is not attributed to the optical feedback but to the chromatic dispersion and to the ASE-induced noise. The latter slightly degrades the eye diagram because of the residual mismatch between the laser operating wavelength (1303 nm) and the SOA gain peak (1310 nm), as shown in Fig. 2. Despite that, the laser still achieves error-free operation for . Overall, those testbed experiments are in agreement with our simulations results, suggesting that QD lasers on silicon have excellent capabilities for isolator-free photonics integration [22,28].
Figure 8.Schematic of the optical feedback apparatus used both for static and dynamic characterizations.
Figure 9.Optical spectra under free-running (blue) and 100% (red) of total reflection for QD laser at (a) and (b) .
Figure 10.(a) BER curves for solitary QD laser and with 100% of backreflection in B2B configuration and after transmission. Eye diagrams (b) of the solitary laser and (c) with 100% feedback in B2B configuration. Eye diagrams (d) of the solitary laser and (e) with 100% feedback after transmission.
7. CONCLUSIONS
To summarize, this work investigates the dynamical and nonlinear features of QD lasers directly grown on silicon. The chirp parameter is revisited with a thermally insensitive method analyzing the residual side-mode dynamics under optical injection locking. Our results are consistent with our initial investigations conducted with the standard ASE method, confirming that the factor of such epitaxial lasers does not exceed 0.32 at threshold. We also show that in spite of a large gain compression factor, the does not increase too much above the threshold. This effect results from a direct consequence of the large ES-to-GS lasing threshold ratio, leading to a critical feedback level that is larger than that of the QW laser. Extraction of the damping factor from the intensity noise showed that values as high as 33 GHz are obtained with QD lasers. Altogether, these features contribute to explaining the reflection insensitivity of the epitaxial QD lasers on silicon, which is highly promising for the realization of isolator-free silicon photonics systems. Future works will investigate the impact of the laser design (e.g., power reflectivity, cavity length) as well as the p doping on the reflection sensitivity and intensity noise.
References
[1] J. C. Norman, D. Jung, Z. Zhang, Y. Wan, S. Liu, C. Shang, R. W. Herrick, W. W. Chow, A. C. Gossard, J. E. Bowers. A review of high-performance quantum dot lasers on silicon. IEEE J. Quantum Electron., 55, 2000511(2019).
[2] K. Nishi, K. Takemasa, M. Sugawara, Y. Arakawa. Development of quantum dot lasers for data-com and silicon photonics applications. IEEE J. Sel. Top. Quantum Electron., 23, 1901007(2017).
[3] C. Sun, M. T. Wade, Y. Lee, J. S. Orcutt, L. Alloatti, M. S. Georgas, A. S. Waterman, J. M. Shainline, R. R. Avizienis, S. Lin, B. R. Moss, R. Kumar, F. Pavanello, A. H. Atabaki, H. M. Cook, A. J. Ou, J. C. Leu, Y.-H. Chen, K. Asanovic, R. J. Ram, M. A. Popovic, V. M. Stojanovic. Single-chip microprocessor that communicates directly using light. Nature, 528, 534-538(2015).
[4] K. Mizutani, K. Yashiki, M. Kurihara, Y. Suzuki, Y. Hagihara, N. Hatori, T. Shimizu, Y. Urino, T. Nakamura, K. Kurata, Y. Arakawa. Isolator free optical I/O core transmitter by using quantum dot laser. 2015 IEEE 12th International Conference on Group IV Photonics (GFP), 177-178(2015).
[5] L. Bi, J. Hu, P. Jiang, D. H. Kim, G. F. Dionne, L. C. Kimerling, C. Ross. On-chip optical isolation in monolithically integrated non-reciprocal optical resonators. Nat. Photonics, 5, 758-762(2011).
[6] T. L. Koch, R. Linke. Effect of nonlinear gain reduction on semiconductor laser wavelength chirping. Appl. Phys. Lett., 48, 613-615(1986).
[7] T. L. Koch, J. E. Bowers. Nature of wavelength chirping in directly modulated semiconductor lasers. Electron. Lett., 20, 1038-1040(1984).
[8] A. Becker, V. Sichkovskyi, M. Bjelica, A. Rippien, F. Schnabel, M. Kaiser, O. Eyal, B. Witzigmann, G. Eisenstein, J. Reithmaier. Widely tunable narrow-linewidth 1.5 μm light source based on a monolithically integrated quantum dot laser array. Appl. Phys. Lett., 110, 181103(2017).
[9] H. Su, H. Li, L. Zhang, Z. Zou, A. Gray, R. Wang, P. Varangis, L. Lester. Nondegenerate four-wave mixing in quantum dot distributed feedback lasers. IEEE Photon. Technol. Lett., 17, 1686-1688(2005).
[10] S. Wieczorek, B. Krauskopf, T. B. Simpson, D. Lenstra. The dynamical complexity of optically injected semiconductor lasers. Phys. Rep., 416, 1-128(2005).
[11] C. Otto, B. Globisch, K. Lüdge, E. Schöll, T. Erneux. Complex dynamics of semiconductor quantum dot lasers subject to delayed optical feedback. Internat. J. Bifur. Chaos, 22, 1250246(2012).
[12] D. O’Brien, S. Hegarty, G. Huyet, J. McInerney, T. Kettler, M. Laemmlin, D. Bimberg, V. Ustinov, A. Zhukov, S. Mikhrin, A. Kovsh. Feedback sensitivity of 1.3 μm InAs/GaAs quantum dot lasers. Electron. Lett., 39, 1819-1820(2003).
[13] B. Lingnau, W. W. Chow, E. Schöll, K. Lüdge. Feedback and injection locking instabilities in quantum-dot lasers: a microscopically based bifurcation analysis. New J. Phys., 15, 093031(2013).
[14] S. Chen, W. Li, J. Wu, Q. Jiang, M. Tang, S. Shutts, S. N. Elliott, A. Sobiesierski, A. J. Seeds, I. Ross, P. M. Smowton, H. Liu. Electrically pumped continuous-wave III–V quantum dot lasers on silicon. Nat. Photonics, 10, 307-311(2016).
[15] J. Duan, H. Huang, D. Jung, Z. Zhang, J. Norman, J. E. Bowers, F. Grillot. Semiconductor quantum dot lasers epitaxially grown on silicon with low linewidth enhancement factor. Appl. Phys. Lett., 112, 251111(2018).
[16] C. Wang, K. Schires, M. Osiński, P. J. Poole, F. Grillot. Thermally insensitive determination of the linewidth broadening factor in nanostructured semiconductor lasers using optical injection locking. Sci. Rep., 6, 27825(2016).
[17] M. Osinski, J. Buus. Linewidth broadening factor in semiconductor lasers: an overview. IEEE J. Quantum Electron., 23, 9-29(1987).
[18] C. Hantschmann, P. P. Vasil’ev, A. Wonfor, S. Chen, M. Liao, A. J. Seeds, H. Liu, R. V. Penty, I. H. White. Understanding the bandwidth limitations in monolithic 1.3 μm InAs/GaAs quantum dot lasers on silicon. J. Lightwave Technol., 37, 949-955(2019).
[19] M. Liao, S. Chen, Z. Liu, Y. Wang, L. Ponnampalam, Z. Zhou, J. Wu, M. Tang, S. Shutts, Z. Liu, P. M. Smowton, S. Yu, A. Seeds, H. Liu. Low-noise 1.3 μm InAs/GaAs quantum dot laser monolithically grown on silicon. Photon. Res., 6, 1062-1066(2018).
[20] D. Jung, J. Norman, M. J. Kennedy, C. Shang, B. Shin, Y. Wan, A. C. Gossard, J. E. Bowers. High efficiency low threshold current 1.3 μm InAs quantum dot lasers on on-axis (001) GaP/Si. Appl. Phys. Lett., 111, 122107(2017).
[21] H. Huang, J. Duan, D. Jung, A. Y. Liu, Z. Zhang, J. Norman, J. E. Bowers, F. Grillot. Analysis of the optical feedback dynamics in InAs/GaAs quantum dot lasers directly grown on silicon. J. Opt. Soc. Am. B, 35, 2780-2787(2018).
[22] A. Y. Liu, T. Komljenovic, M. L. Davenport, A. C. Gossard, J. E. Bowers. Reflection sensitivity of 1.3 μm quantum dot lasers epitaxially grown on silicon. Opt. Express, 25, 9535-9543(2017).
[23] L. A. Coldren, S. W. Corzine, M. L. Mashanovitch. Diode Lasers and Photonic Integrated Circuits(2012).
[24] F. Grillot, B. Dagens, J.-G. Provost, H. Su, L. F. Lester. Gain compression and above-threshold linewidth enhancement factor in 1.3-μm InAs-GaAs quantum-dot lasers. IEEE J. Quantum Electron., 44, 946-951(2008).
[25] H. Su, L. F. Lester. Dynamic properties of quantum dot distributed feedback lasers: high speed, linewidth and chirp. J. Phys. D, 38, 2112-2118(2005).
[26] F. Grillot, N. Naderi, J. Wright, R. Raghunathan, M. Crowley, L. Lester. A dual-mode quantum dot laser operating in the excited state. Appl. Phys. Lett., 99, 231110(2011).
[27] Z. Zhang, D. Jung, J. C. Norman, P. Patel, W. W. Chow, J. E. Bowers. Effects of modulation p doping in InAs quantum dot lasers on silicon. Appl. Phys. Lett., 113, 061105(2018).
[28] J. Duan, H. Huang, B. Dong, D. Jung, J. C. Norman, J. E. Bowers, F. Grillot. 1.3-μm reflection insensitive InAs/GaAs quantum dot lasers directly grown on silicon. IEEE Photon. Technol. Lett., 31, 345-348(2019).


