• Acta Optica Sinica
  • Vol. 41, Issue 1, 0130002 (2021)
Wei Jin1、2、*, Haihong Bao1、2、**, Yun Qi1、2, Yan Zhao1、2, Pengcheng Zhao1, Shoufei Gao1, and Hoi Lut Ho1、2
Author Affiliations
  • 1Department of Electrical Engineering, The Hong Kong Polytechnic University, Hong Kong, China
  • 2Photonics Research Center, The Hong Kong Polytechnic University Shenzhen Research Institute, Shenzhen, Guangdong 518057, China
  • show less
    DOI: 10.3788/AOS202141.0130002 Cite this Article Set citation alerts
    Wei Jin, Haihong Bao, Yun Qi, Yan Zhao, Pengcheng Zhao, Shoufei Gao, Hoi Lut Ho. Micro/nano-Structured Optical Fiber Laser Spectroscopy[J]. Acta Optica Sinica, 2021, 41(1): 0130002 Copy Citation Text show less
    Basic elements of a laser spectroscopy system
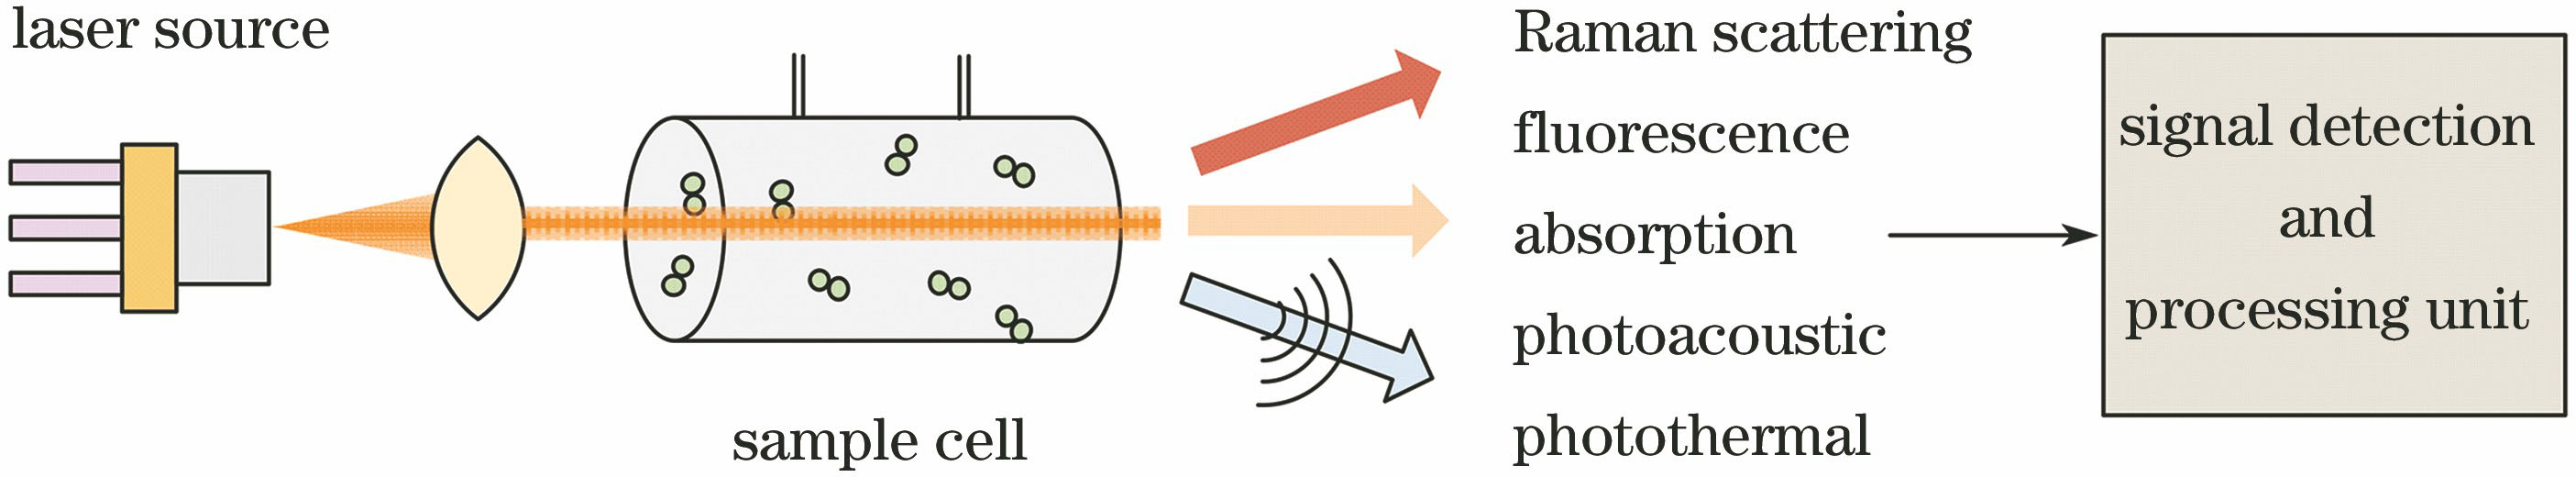
    Fig. 1. Basic elements of a laser spectroscopy system
    Different types of micro/nano-structured optical fibers that can be used for gas or liquid sample cells. (a) PBG-HCF; (b) AR-HCF; (c) NF; (d) SCF
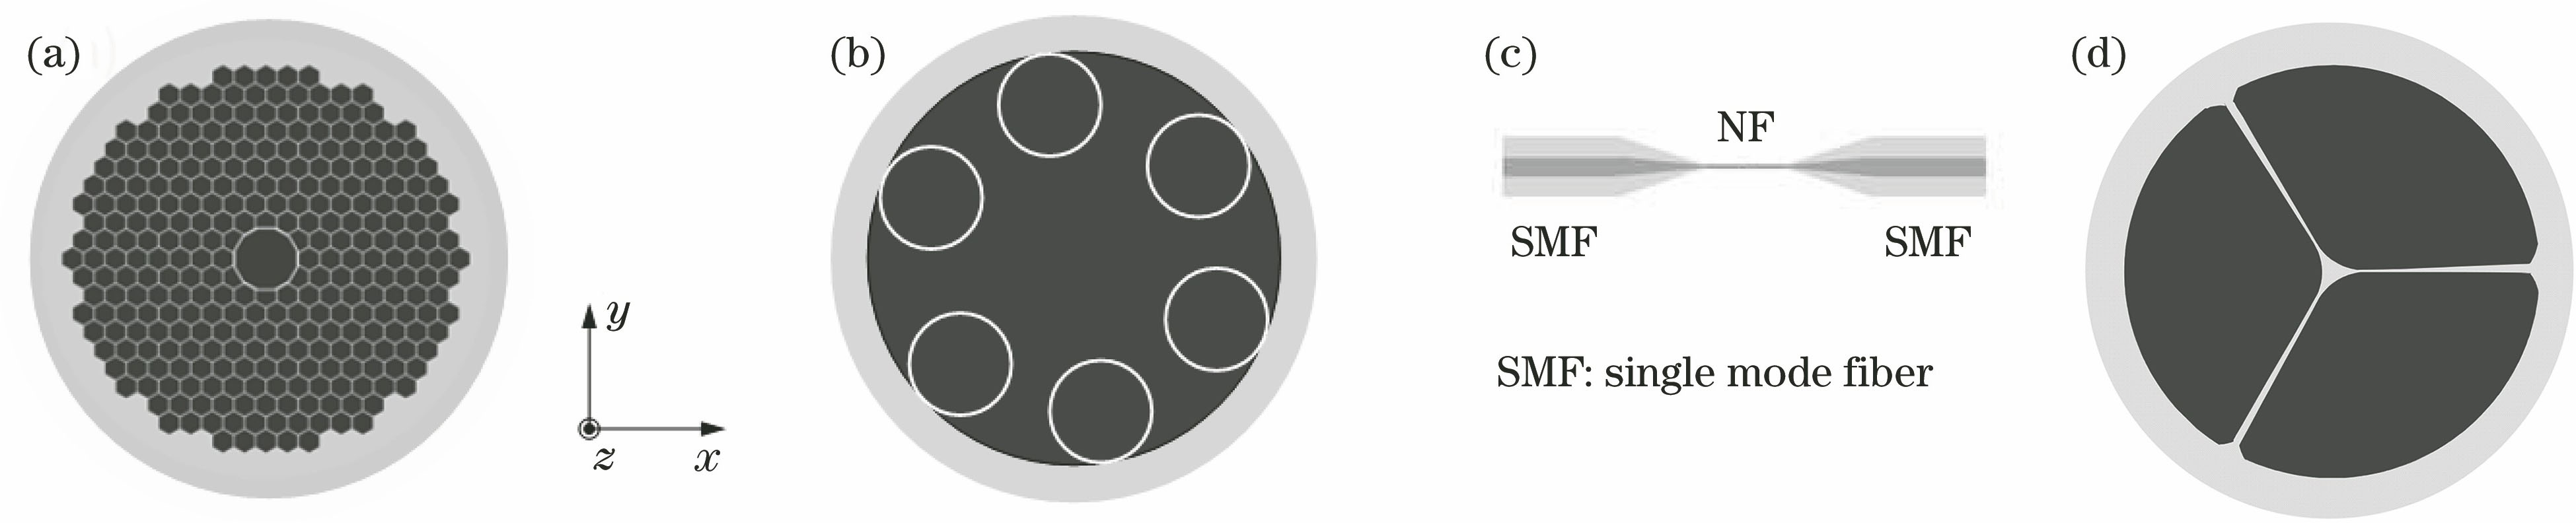
    Fig. 2. Different types of micro/nano-structured optical fibers that can be used for gas or liquid sample cells. (a) PBG-HCF; (b) AR-HCF; (c) NF; (d) SCF
    Transmission properties of PBG-HCF. (a) Loss spectra of three types of PBG-HCF; (b) fundamental mode field intensity distribution of the HC-1550 fiber
    Fig. 3. Transmission properties of PBG-HCF. (a) Loss spectra of three types of PBG-HCF; (b) fundamental mode field intensity distribution of the HC-1550 fiber
    Waveguiding in AR-HCF. (a) Reflection and refraction of light in thin-film Fabry-Perot cavity; (b) variation of reflectivity with wavelength for a silica thin film with d=370 nm and n=1.45 at θ=87°; (c) loss spectra of three types of AR-HCF, and inset is the cross-sectional image of the AR-HCF that has transmission window in the ultraviolet[12]
    Fig. 4. Waveguiding in AR-HCF. (a) Reflection and refraction of light in thin-film Fabry-Perot cavity; (b) variation of reflectivity with wavelength for a silica thin film with d=370 nm and n=1.45 at θ=87°; (c) loss spectra of three types of AR-HCF, and inset is the cross-sectional image of the AR-HCF that has transmission window in the ultraviolet[12]
    Waveguiding properties of NF[14]. (a) Variation of refractive index of a silica NF mode with D/λ; (b) fraction of fundamental mode field energy in silica core (1-γ, γ is the fraction in air), the mode field area A, and the maximum intensity I on optical fiber surface as functions of fiber diameter at λ=1.55 μm; (c) light intensity distribution of silica NF with D=0.5 μm at λ=1.55 μm
    Fig. 5. Waveguiding properties of NF[14]. (a) Variation of refractive index of a silica NF mode with D/λ; (b) fraction of fundamental mode field energy in silica core (1-γ, γ is the fraction in air), the mode field area A, and the maximum intensity I on optical fiber surface as functions of fiber diameter at λ=1.55 μm; (c) light intensity distribution of silica NF with D=0.5 μm at λ=1.55 μm
    HCF gas cells. (a) Free-space coupling; (b) fiber-to-fiber mechanical splicing
    Fig. 6. HCF gas cells. (a) Free-space coupling; (b) fiber-to-fiber mechanical splicing
    Microchannels on the side of the HCF. (a) Schematic of gas cell and microchannels for gas charging and discharging; (b) transmission spectra for different number of microchannels fabricated on PBG-HCF with length of 2.3 m[22]
    Fig. 7. Microchannels on the side of the HCF. (a) Schematic of gas cell and microchannels for gas charging and discharging; (b) transmission spectra for different number of microchannels fabricated on PBG-HCF with length of 2.3 m[22]
    Calculated loss spectra when the all holes of HC-1550-02 fiber are filled with liquid of different refractive index[23]
    Fig. 8. Calculated loss spectra when the all holes of HC-1550-02 fiber are filled with liquid of different refractive index[23]
    Photonic band-gap dispersion diagram of air-silica microstructure cladding, and inset is the cladding microstructure and its parameters[27]
    Fig. 9. Photonic band-gap dispersion diagram of air-silica microstructure cladding, and inset is the cladding microstructure and its parameters[27]
    Calculated loss spectra of AR-HCF filled with liquid of different refractive index, and inset is cross-sectional image of the AR-HCF and its fundamental mode field intensity profile[28]
    Fig. 10. Calculated loss spectra of AR-HCF filled with liquid of different refractive index, and inset is cross-sectional image of the AR-HCF and its fundamental mode field intensity profile[28]
    Schematic of a water-filled AR-HCF and microfluid channel[29]
    Fig. 11. Schematic of a water-filled AR-HCF and microfluid channel[29]
    NF sample cell and its waveguiding properties. (a) Encapsulated NF sample cell; (b) comparison between mode field distributions of silica NF with diameter of 1.2 μm in air cladding and alcohol (refractive index is 1.36) cladding; (c) variation of fraction of mode field energy in liquid sample, the mode field area, and the maximum intensity on optical fiber surface with refractive index of liquid cladding for a silica NF with diameter of 1.2 μm at λ=1.55 μm
    Fig. 12. NF sample cell and its waveguiding properties. (a) Encapsulated NF sample cell; (b) comparison between mode field distributions of silica NF with diameter of 1.2 μm in air cladding and alcohol (refractive index is 1.36) cladding; (c) variation of fraction of mode field energy in liquid sample, the mode field area, and the maximum intensity on optical fiber surface with refractive index of liquid cladding for a silica NF with diameter of 1.2 μm at λ=1.55 μm
    HCF gas detection system based on laser absorption spectroscopy[31]. (a) Measurement setup for acetylene based on PBG-HCF gas cell and direct absorption spectroscopy; (b) second harmonic output as the pump wavelength is scanned across an acetylene absorption line
    Fig. 13. HCF gas detection system based on laser absorption spectroscopy[31]. (a) Measurement setup for acetylene based on PBG-HCF gas cell and direct absorption spectroscopy; (b) second harmonic output as the pump wavelength is scanned across an acetylene absorption line
    Photothermal gas detection system based on optical fiber Mach-Zehnder interferometer[37]
    Fig. 14. Photothermal gas detection system based on optical fiber Mach-Zehnder interferometer[37]
    Results of gas detection with HCF photothermal interferometry[37]. (a) Second harmonic output corresponding to different acetylene volume fractions; (b) variation of peak-peak value of second harmonic output with acetylene volume fractions
    Fig. 15. Results of gas detection with HCF photothermal interferometry[37]. (a) Second harmonic output corresponding to different acetylene volume fractions; (b) variation of peak-peak value of second harmonic output with acetylene volume fractions
    Frequency responses of photothermal phase modulation in PBG-HCF and AR-HCF filled with acetylene and nitrogen gas mixture[40]
    Fig. 16. Frequency responses of photothermal phase modulation in PBG-HCF and AR-HCF filled with acetylene and nitrogen gas mixture[40]
    Schematic of photothermal interferometry gas detection based on hollow fiber Fabry-Perot interferometer[41]
    Fig. 17. Schematic of photothermal interferometry gas detection based on hollow fiber Fabry-Perot interferometer[41]
    Principle of mode-phase-difference photothermal spectroscopy technology[42]. (a) Scanning electron microscope image of the two-mode AR-HCF; (b)(c) near field intensity profiles of LP01 and LP11 modes of the AR-HCF; (d) pump LP01 mode; (e) temperature(refractive index) distribution due to gas absorption of pump and intensity distribution of LP01 and LP11 modes of the probe light; (f) a dual-mo
    Fig. 18. Principle of mode-phase-difference photothermal spectroscopy technology[42]. (a) Scanning electron microscope image of the two-mode AR-HCF; (b)(c) near field intensity profiles of LP01 and LP11 modes of the AR-HCF; (d) pump LP01 mode; (e) temperature(refractive index) distribution due to gas absorption of pump and intensity distribution of LP01 and LP11 modes of the probe light; (f) a dual-mo
    Photothermal and photoacoustic signals in AR-HCF filled with 10 bar acetylene and nitrogen gas mixture with 100×10-6 (100 ppm), inset is a cross-sectional image of the AR-HCF
    Fig. 19. Photothermal and photoacoustic signals in AR-HCF filled with 10 bar acetylene and nitrogen gas mixture with 100×10-6 (100 ppm), inset is a cross-sectional image of the AR-HCF
    HCF gas detection system with stimulated Raman gain spectroscopy[48]. (a) All fiber hydrogen detection system based on stimulated Raman gain; (b) second harmonic output signal for different pump power level
    Fig. 20. HCF gas detection system with stimulated Raman gain spectroscopy[48]. (a) All fiber hydrogen detection system based on stimulated Raman gain; (b) second harmonic output signal for different pump power level
    Second harmonic output due to Raman dispersion for different hydrogen concentration[49]
    Fig. 21. Second harmonic output due to Raman dispersion for different hydrogen concentration[49]
    Principle of photothermal spectroscopy with a NF[51]. (a) Principle of photothermal phase modulation in NF, left is the evanescent field distribution of pump, and right is the mode field distribution of probe with different wavelength; (b) photothermal phase modulation efficiency of fundamental modes for NF with different diameters
    Fig. 22. Principle of photothermal spectroscopy with a NF[51]. (a) Principle of photothermal phase modulation in NF, left is the evanescent field distribution of pump, and right is the mode field distribution of probe with different wavelength; (b) photothermal phase modulation efficiency of fundamental modes for NF with different diameters
    Principle of photoacoustic gas detection based on the NF and QTF[52]
    Fig. 23. Principle of photoacoustic gas detection based on the NF and QTF[52]
    Principle of hydrogen detection based on stimulated Raman spectroscopy with a NF[54]. (a) Comparison of Raman scattering efficiency between NF with different diameters and selected commercial PBG-HCF(HC-1550-02, HC-1060-02, HC-800-02, HC-580-02, and HC-440-02); (b) hydrogen measurement principle based on NF evanescent field and stimulated Raman gain
    Fig. 24. Principle of hydrogen detection based on stimulated Raman spectroscopy with a NF[54]. (a) Comparison of Raman scattering efficiency between NF with different diameters and selected commercial PBG-HCF(HC-1550-02, HC-1060-02, HC-800-02, HC-580-02, and HC-440-02); (b) hydrogen measurement principle based on NF evanescent field and stimulated Raman gain
    Transmission spectra of PBG-HCF filled with Cy5-labeled DNA solution (solid curve) and pure water (dashed curve), respectively, and inset is absorption spectrum of the Cy5-labeled DNA solution[55]
    Fig. 25. Transmission spectra of PBG-HCF filled with Cy5-labeled DNA solution (solid curve) and pure water (dashed curve), respectively, and inset is absorption spectrum of the Cy5-labeled DNA solution[55]
    Thick lines are absorption and fluorescence spectra of the PBG-HCF (HC-532-01) filled with R6G solution with concentrations of 5×10⁻⁷ mol/L and 1×10⁻⁹ mol/L, respectively. Thin lines are absorption and fluorescence spectra of R6G solution with concentration of 1.7×10⁻⁶ mol/L measured by free space optical system[57]
    Fig. 26. Thick lines are absorption and fluorescence spectra of the PBG-HCF (HC-532-01) filled with R6G solution with concentrations of 5×10⁻⁷ mol/L and 1×10⁻⁹ mol/L, respectively. Thin lines are absorption and fluorescence spectra of R6G solution with concentration of 1.7×10⁻⁶ mol/L measured by free space optical system[57]
    Raman signal of different liquid-filled HCFs[62]. (a) Normal Raman spectra acquired using PBG-HCF (HC19-1550-01)filled with water (A), ethanol (B), 1% ethanol in water (C), and using a glass vial containing 1% ethanol in water (D); (b) surface enhanced Raman spectra obtained using PBG-HCF(HC19-1550-01) filled with colloidal silver nanoparticles and SCN-solution with solution of 1.7×10⁻⁷ mol/L (A), and using a glass vial fill
    Fig. 27. Raman signal of different liquid-filled HCFs[62]. (a) Normal Raman spectra acquired using PBG-HCF (HC19-1550-01)filled with water (A), ethanol (B), 1% ethanol in water (C), and using a glass vial containing 1% ethanol in water (D); (b) surface enhanced Raman spectra obtained using PBG-HCF(HC19-1550-01) filled with colloidal silver nanoparticles and SCN-solution with solution of 1.7×10⁻⁷ mol/L (A), and using a glass vial fill
    Wei Jin, Haihong Bao, Yun Qi, Yan Zhao, Pengcheng Zhao, Shoufei Gao, Hoi Lut Ho. Micro/nano-Structured Optical Fiber Laser Spectroscopy[J]. Acta Optica Sinica, 2021, 41(1): 0130002
    Download Citation