
Pan Wang, Shunyu Yao, Philippe Grelu, Xiaosheng Xiao, Changxi Yang. Pattern formation in 2-μm Tm Mamyshev oscillators associated with the dissipative Faraday instability[J]. Photonics Research, 2019, 7(11): 1287
- Photonics Research
- Vol. 7, Issue 11, 1287 (2019)
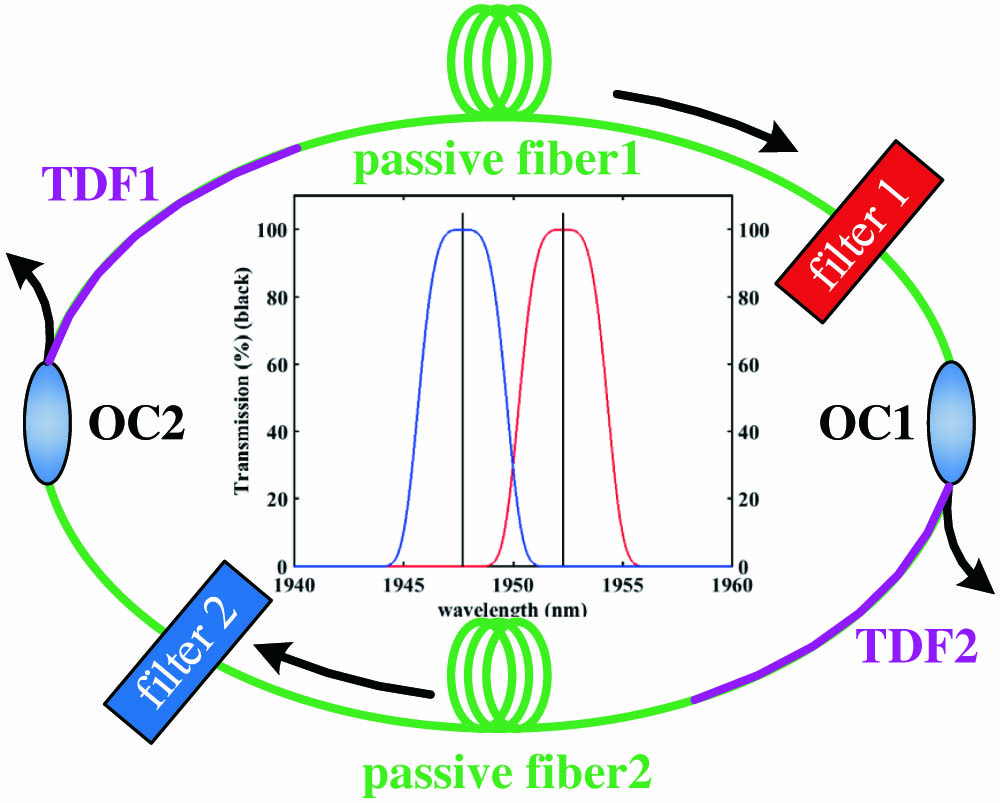
Fig. 1. Schematic diagram of the 2-μm fiber ring cavity in a Mamyshev oscillator configuration. OC, optical coupler; TDF, Tm-doped gain fiber; filter 1, longer-wavelength super-Gaussian spectral filter; filter 2, shorter-wavelength super-Gaussian spectral filter; passive fiber, the commercial normal dispersion fiber (NDF).
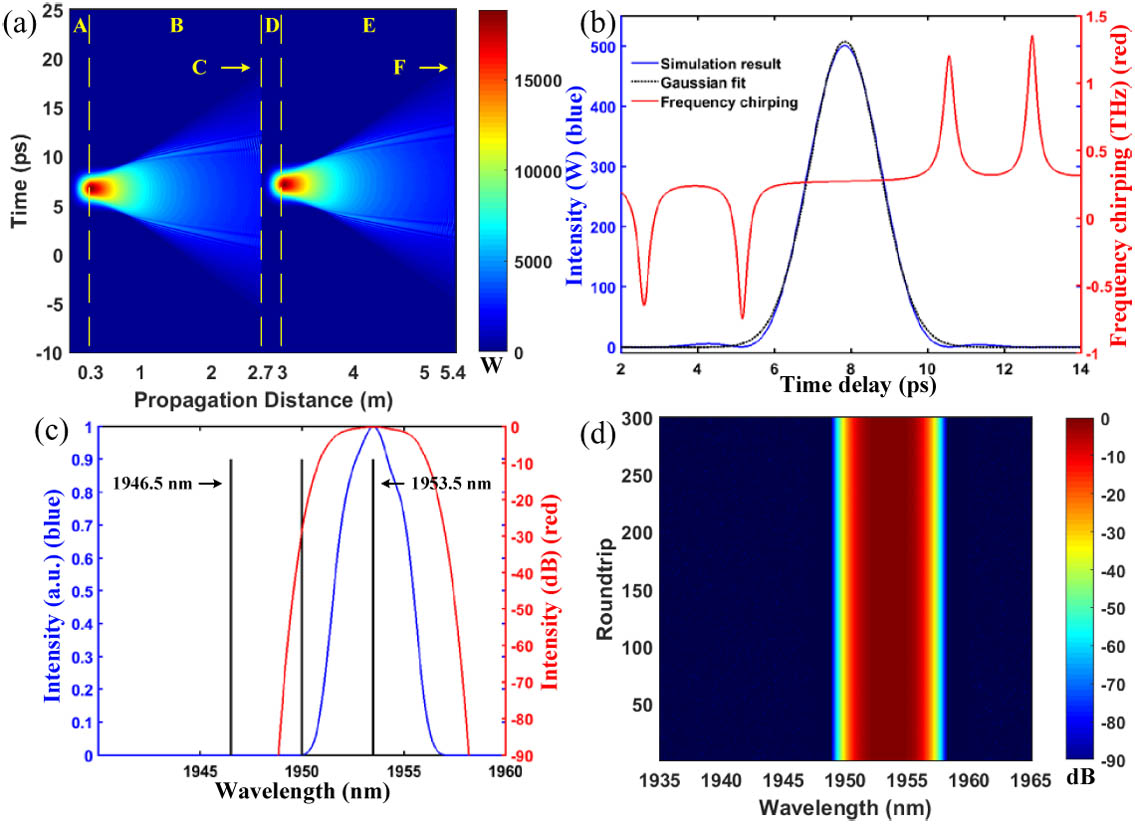
Fig. 2. Spatiotemporal dynamics of single pulse operation: (a) temporal spectral evolution during per cavity roundtrip. A, B, C, D, E, and F represent the TDF1, passive fiber1, filter1 + OC1, TDF2, passive fiber2, and filter2 + OC2; (b) temporal (blue) and frequency chirping (red) profiles after the interaction with the longer-wavelength filter; (c) spectral pulse profile (blue) after the longer-wavelength filter (red); (d) spectral evolution over 300 roundtrips at the output of OC1 (color scale for the optical intensity, in dB). The cavity parameters are g 0 = 12.8 E sat = 19.4 nJ and Δ Ω = 7.0 nm
Fig. 3. Spatiotemporal dynamics of soliton pair molecule operation: (a) temporal evolution during per cavity roundtrip. A, B, C, D, E, and F represent the TDF1, passive fiber1, filter1 + OC1, TDF2, passive fiber2, and filter2 + OC2; (b) temporal and frequency chirping profiles after the longer-wavelength filter; (c) spectral profiles after the longer-wavelength filter; (d) spectral evolution over 300 roundtrips at the output of OC1. The remaining parameters are g 0 = 16.2 E sat = 19.4 nJ and Δ Ω = 7.0 nm
Fig. 4. Spatiotemporal dynamics of random pulse train operation: (a) temporal and (c) spectral evolution over 300 roundtrips at the output of OC1; (b) temporal and (d) spectral evolution during per cavity roundtrip. A, B, C, D, E, and F represent the TDF1, passive fiber1, filter1 + OC1, TDF2, passive fiber2, and filter2 + OC2. The remaining parameters are g 0 = 16.2 E sat = 19.4 nJ and Δ Ω = 5.4 nm
Fig. 5. Spatiotemporal dynamics of regular pattern formation: (a) temporal and (c) spectral evolution over 300 roundtrips at the output of OC1; (b) temporal and (d) spectral evolution during per cavity roundtrip. A, B, C, D, E, and F represent the TDF1, passive fiber1, filter1 + OC1, TDF2, passive fiber2, and filter2 + OC2. The remaining parameters are g 0 = 16.2 E sat = 19.4 nJ and Δ Ω = 4.6 nm
Fig. 6. Spatiotemporal profiles of regular pattern formation: single pulse temporal profiles (a) before and (b) after the interaction with the longer-wavelength filter; (c) pulse train temporal and phase profiles after the longer-wavelength filter; (d) spectral profile after the longer-wavelength filter.
Fig. 7. Spatiotemporal dynamics of irregular pattern formation: (a) temporal and (c) spectral evolution over 300 roundtrips at the output of OC1; (b) temporal and (d) spectral evolution during per cavity roundtrip. A, B, C, D, E, and F represent the TDF1, passive fiber1, filter1 + OC1, TDF2, passive fiber2, and filter2 + OC2. The remaining parameters are g 0 = 16.2 E sat = 19.4 nJ and Δ Ω = 4.2 nm
Fig. 8. Spatiotemporal dynamics of irregular pattern formation: (a) temporal and (c) spectral evolution over 300 roundtrips at the output of OC1; (b) temporal and (d) spectral evolution during per cavity roundtrip. A, B, C, D, E, and F represent the TDF1, passive fiber1, filter1 + OC1, TDF2, passive fiber2, and filter2 + OC2. The remaining parameters are g 0 = 16.2 E sat = 19.4 nJ and Δ Ω = 2.8 nm
Fig. 9. Temporal and phase profiles of the RWs’ generation after the longer-wavelength filter. The remaining parameters are g 0 = 16.2 E sat = 19.4 nJ and Δ Ω = 2.0 nm
Fig. 10. Influence of the frequency detuning between the filters on RWs generation: histogram on log scale showing the statistics distribution of the pulse intensity for Δ Ω g 0 = 16.2 E sat = 19.4 nJ
Fig. 11. Spatiotemporal dynamics of regular pattern formation in the near-zero dispersion fiber ring setup (see text): (a) temporal and (c) spectral evolution over 300 roundtrips at the output of OC1; (b) temporal and (d) spectral evolution during per cavity roundtrip. A, B, C, D, E, and F represent the TDF1, passive fiber1, filter1+OC1, TDF2, passive fiber2, and filter2+OC2. The remaining parameters are g 0 = 16.8 E sat = 16.4 nJ and Δ Ω = 5.4 nm
Fig. 12. Spatiotemporal profiles of regular pattern formation: single pulse temporal profiles (a) before and (b) after the interaction with the longer-wavelength filter; (c) pulse train temporal and phase profiles after the longer-wavelength filter; (d) spectral profile after the longer-wavelength filter.
Fig. 13. Spatiotemporal dynamics of irregular pattern formation: (a) temporal and (b) spectral evolution over 300 roundtrips at the output of OC1 (the remaining parameters are g 0 = 16.8 E sat = 16.4 nJ and Δ Ω = 3.6 nm g 0 = 16.8 E sat = 16.4 nJ and Δ Ω = 2.4 nm
Fig. 14. Influence of the frequency detuning between the filters on RWs’ generation: histogram on log scale showing the statistics distribution of the pulse intensity for Δ Ω g 0 = 16.8 E sat = 16.4 nJ

Set citation alerts for the article
Please enter your email address
© Copyright 2018-2021 | Chinese Laser Press. All Rights Reserved 沪ICP备15018463号-20