
Li Song, Edmund Y. Lam, "Fast and robust phase retrieval for masked coherent diffractive imaging," Photonics Res. 10, 758 (2022)
- Photonics Research
- Vol. 10, Issue 3, 758 (2022)
![Typical masked CDI: in situ CDI setup [31].](/richHtml/prj/2022/10/3/03000758/img_001.jpg)
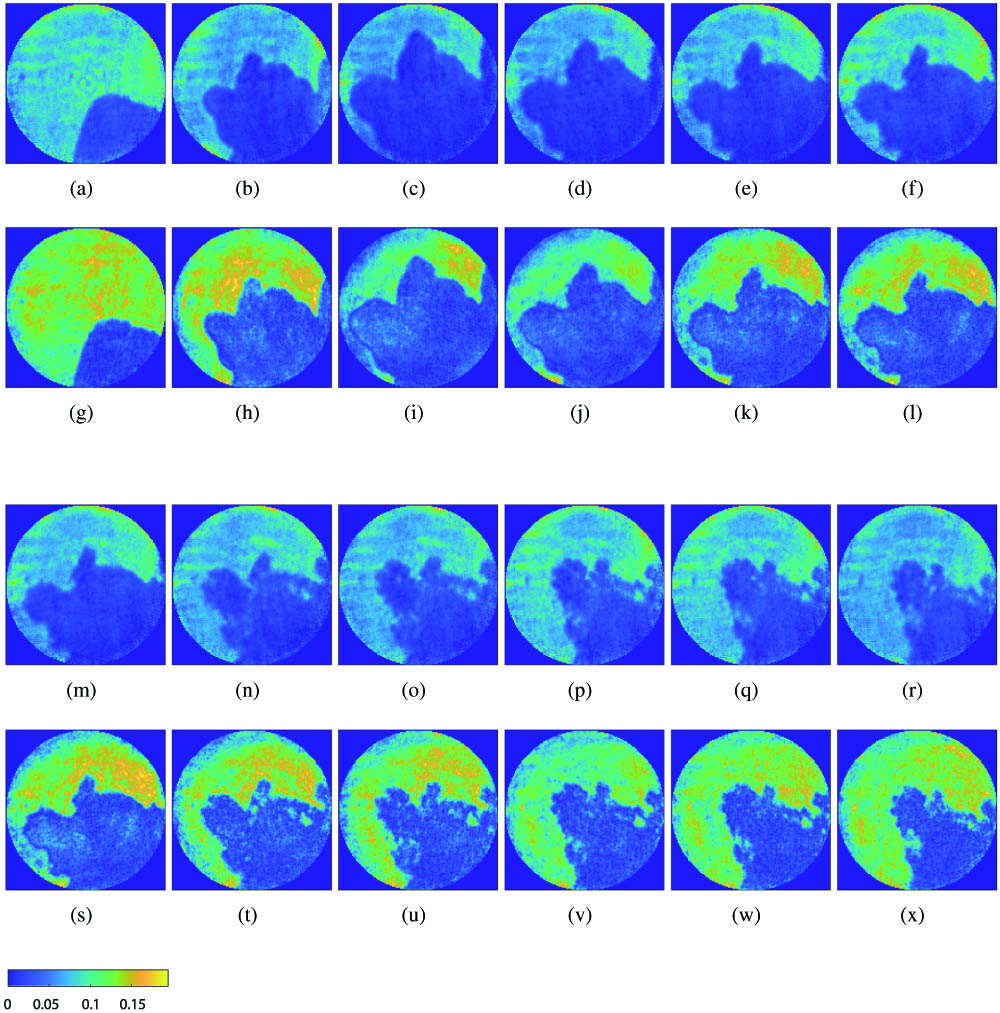
Fig. 2. Imaging results of the Pb growth experiment (amplitude reconstructions). (a)–(f), (m)–(r) ADMM phase retrieval results for No. 1–12 diffraction patterns; (g)–(l), (s)–(x) phase retrieval results for No. 1–12 diffraction patterns using the baseline method, respectively.
Fig. 3. ADMM iterations for the Pb growth experiment (different colors for different diffraction patterns). Both converge quickly. (a) Error. (b) R -factor.
Fig. 4. Reconstructed object planes for No. 1 diffraction pattern. The main difference is the area outside the support. (a) ADMM. (b) Baseline.
Fig. 5. Imaging results of No. 1 diffraction pattern in the Pb growth experiment (amplitude reconstructions) using different phase retrieval methods. (a) Baseline. (b) ADMM. (c) WF. (d) TWF.
Fig. 6. ADMM iterations for the glioblastoma experiment (different colors for different diffraction patterns). (a) Error. (b) R -factor.
Fig. 7. Imaging results of the glioblastoma experiment (phase reconstructions). (a)–(f), (m)–(r) ADMM phase retrieval results for No. 1–12 diffraction patterns; (g)–(l), (s)–(x) phase retrieval results for No. 1–12 diffraction patterns using the baseline method, respectively.
Fig. 8. Processing time in different experiments (unit: s). (a) Pb growth experiment. (b) Glioblastoma experiment.
Fig. 9. Phase retrieval results with single diffraction pattern. (a), (b) Baseline method and ADMM method for No. 10 diffraction pattern in the Pb growth experiment; (c), (d) baseline method and ADMM method for No. 7 diffraction pattern in the glioblastoma experiment, respectively.
|
Table 1. Numerical Comparison between ADMM and Baseline Method for Pb Growth Experiment
|
Table 1. PnP-ADMM for Masked CDI
|
Table 2. Mean Total Variation Loss of Different Methods for Glioblastoma Experiment
|
Table 3. Processing Time of Different Algorithms in Pb Growth Experiment (Unit: s)
|
Table 4. Processing Time of Different Algorithms in Glioblastoma Experiment (Unit: s)


Set citation alerts for the article
Please enter your email address

© Copyright 2018-2021 | Chinese Laser Press. All Rights Reserved 沪ICP备15018463号-20