
S. Borneis, T. Laštovička, M. Sokol, T.-M. Jeong, F. Condamine, O. Renner, V. Tikhonchuk, H. Bohlin, A. Fajstavr, J.-C. Hernandez, N. Jourdain, D. Kumar, D. Modřanský, A. Pokorný, A. Wolf, S. Zhai, G. Korn, S. Weber, "Design, installation and commissioning of the ELI-Beamlines high-power, high-repetition rate HAPLS laser beam transport system to P3," High Power Laser Sci. Eng. 9, 02000e30 (2021)
- High Power Laser Science and Engineering
- Vol. 9, Issue 2, 02000e30 (2021)
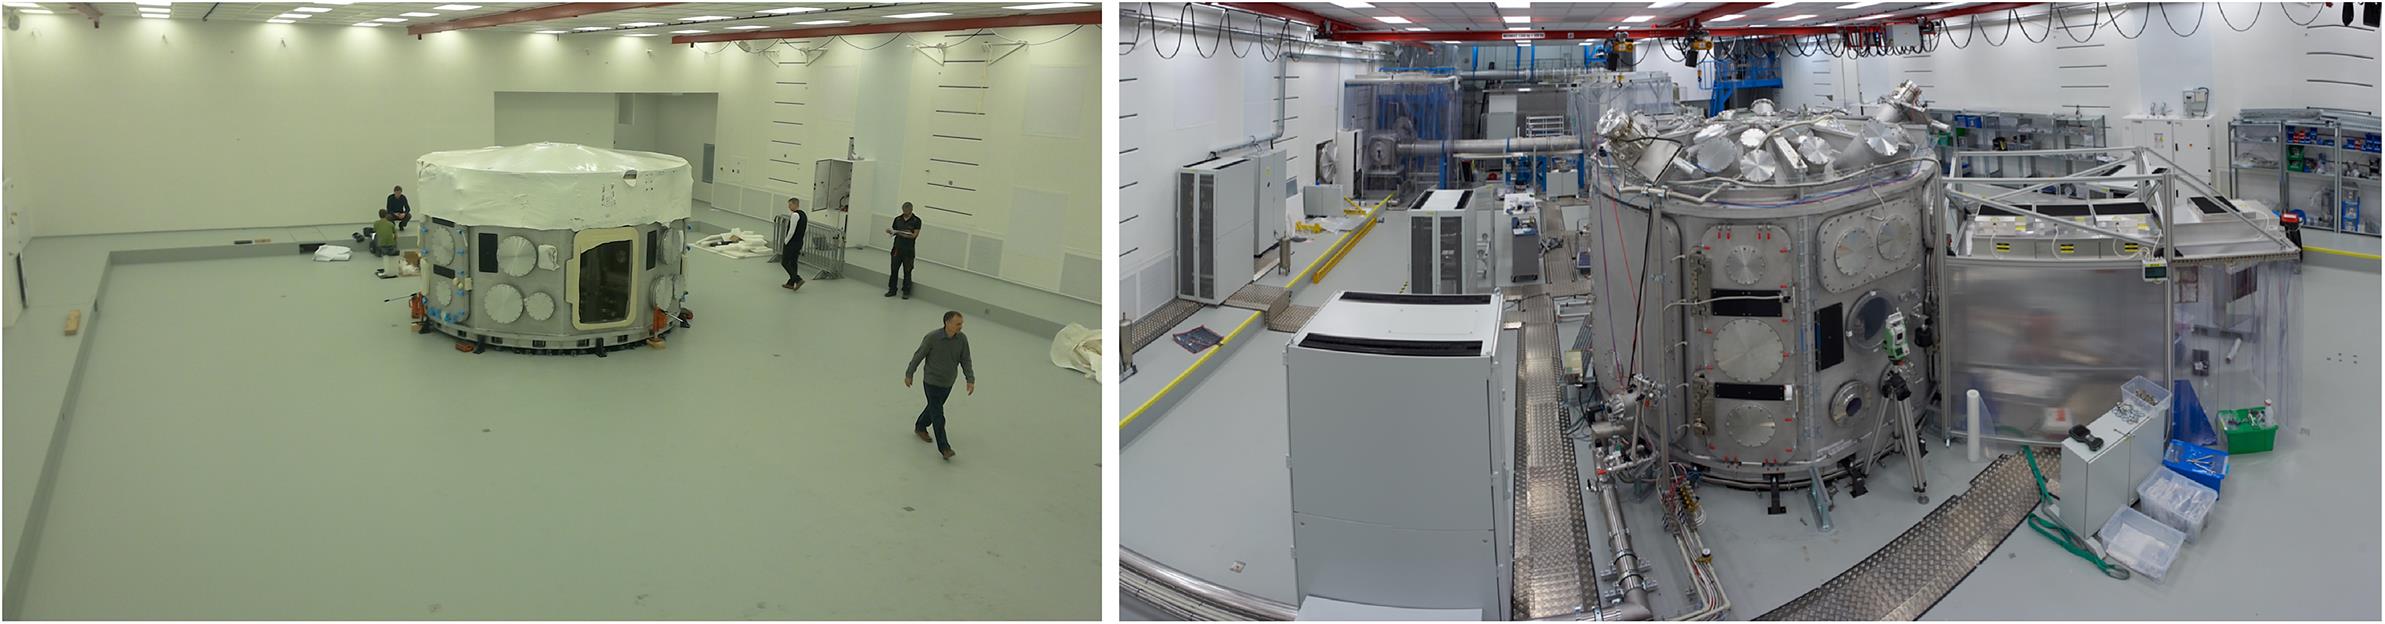
Fig. 1. Left: The state of the experimental hall E3 in January 2018. Note that the P3 chamber is not yet fully assembled. Right: The same location in November 2019 with a fully functional BT system and experimental chamber.
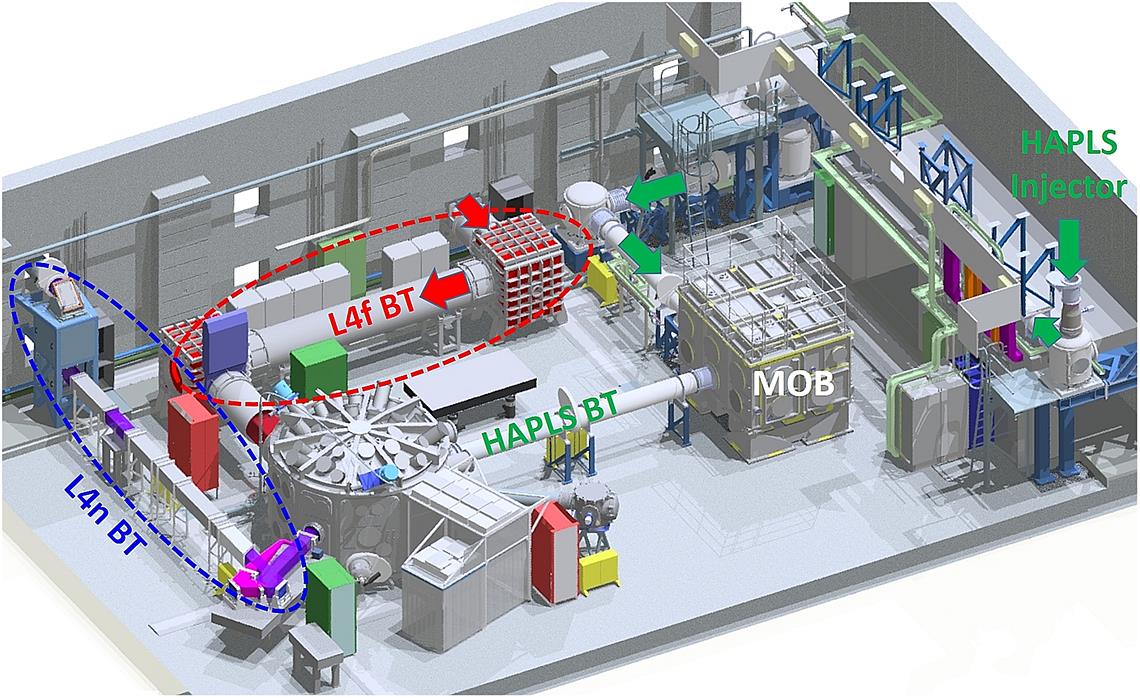
Fig. 2. Layout of the experimental hall by the end of 2022. With respect to the present state, the BT for L4f and L4n is missing, as is the MOB chamber.
Fig. 3. Top view of the HAPLS vacuum BT system located in the basement of the laser building below the laser floor. The P3 is located in the experimental hall E3.
Fig. 4. 3D CAD visualization of the HAPLS BT from the injector chamber to the P3 chamber. This figure shows the actual installation in E3.
Fig. 5. Typical random vibration PSD plot for vibrations in the horizontal direction measured in the experimental halls with no supplies running[19]. Note that NIF limits the PSD to a maximum of  at higher vibration frequencies[20].
at higher vibration frequencies[20]. Fig. 6. Model predictions of the L3-E3-F020 tower’s first four eigenfrequencies and mode shapes. The next four eigenfrequencies are at 121.9, 128.5, 136.9 and 148.2 Hz[21].
Fig. 7. Measured PSD spectrum with eigenfrequencies of tower L3-E3-F020.
Fig. 8. Measured acceleration PSD of granite block L3-E3-F040 and the tower L3-E3-F020. The PSD on the granite is  /Hz and on the tower
  /Hz for the frequency band from 50 to 300 Hz. The PSD of the granite for frequencies between 1 and 50 Hz is 10–100 times lower than that of the tower.
/Hz and on the tower /Hz for the frequency band from 50 to 300 Hz. The PSD of the granite for frequencies between 1 and 50 Hz is 10–100 times lower than that of the tower. Fig. 9. Photo of the 100 mm thick aluminium breadboard with its four monolithic stainless-steel legs.
Fig. 10. Mounted HAPLS BT mirror installed in its vacuum chamber and both, chamber and breadboard legs/feet bolted onto the aluminium chamber base plate in ISO 5 class cleanroom.
Fig. 11. Displacement PSD with the first eigenfrequencies of the mirror mount measured with an Attocube IDS 3010 sensor. The first eigenfrequency is at 109 Hz, and the second is at 125 Hz. The mount was clamped onto the breadboard, which was bolted onto the chamber base plate, which was bolted onto the granite block L3-E3-F040; see Figure 4 .
Fig. 12. Wall-mounted Attocube IDS 3010 sensor with mirror mount bolted onto its breadboard installed on the chamber base plate and granite block L3-E3-F040.
Fig. 13. Overview of the HAPLS BT switchyards in the E3 experimental hall and the E5 switchyard in the L4c hall.
Fig. 14. Measured RWE at AOI  . Left: After subtracting piston, tilt, power and astigmatism. Right: After subtracting piston and tilt only.
. Left: After subtracting piston, tilt, power and astigmatism. Right: After subtracting piston and tilt only. Fig. 15. Summation of all five RWEs of the E3 BT mirrors guiding HAPLS to P3, after optimization of the orientation to cancel wavefront deformations and subtracting power and astigmatism. The SR is 99%.
Fig. 16. Measured surface of the  mm 30° off-axis protected gold commissioning parabola, yielding an SR of 96% for the central
  mm aperture.
mm 30° off-axis protected gold commissioning parabola, yielding an SR of 96% for the central mm aperture. Fig. 17. LDT measurement of 2 inch diameter turn mirror coating witness sample with an approximately  diameter beam spot of the ATLAS laser on the sample: 5 Hz repetition rate,
  fs pulse length, p-polarization with respect to the sample, 1 mm raster scan (LEX Photonics, LMU Munich).
diameter beam spot of the ATLAS laser on the sample: 5 Hz repetition rate, fs pulse length, p-polarization with respect to the sample, 1 mm raster scan (LEX Photonics, LMU Munich). Fig. 18. Comparison of P3 RGA measurements before and after P3 laser cleaning. The levels of contaminants were decreased by two to three orders of magnitude.
Fig. 19. Cleaning of the P3 chamber floor shows a clear visual difference between the cleaned surface area and the non-cleaned area[31].
Fig. 20. Measured RGA spectrum of a BT vacuum vessel with the partial pressures of all masses up to 200 AMU at a total pressure of 10−6 mbar.
Fig. 21. Assembly of HAPLS BT vacuum vessels and optomechanics in cleanroom class ISO 5.
Fig. 22. Clean installation in experimental hall E3. Local cleanroom tents were constructed and built to allow clean access to the mirror chambers and to connect them via bellows to the adjacent DN500 pipes.
Fig. 23. Working inside P3. The interior of the P3 experimental chamber is treated as a cleanliness class ISO 5 cleanroom, whereas the experimental hall E3 is an ISO 7 cleanroom.
Fig. 24. The blue alignment laser setup in E3.
Fig. 25. 3D CAD picture of the injection of the 417.5 nm blue alignment laser beam into the HAPLS BT system at the lower injector periscope in chamber E3-CH010.
Fig. 26. Top: Last BT mirror in chamber E3-CH050 in front of P3 with the alignment module (left) and the second 417.5 nm ‘iBeam smart’ being injected straight to P3. Bottom: Camera image with measured iBeam smart leak beam and shadow of the mirror mount’s rear surface alignment cross (left) and mirror chamber with alignment module (black) installed at the exit of the flange to monitor the pilot laser leak beam position with respect to the alignment cross (right).
Fig. 27. Schematics of the alignment module in which the leak beam is demagnified and relay imaged together with the shadow of the alignment cross onto a camera.
Fig. 28. Front (coated) and rear surface reflections of injector bottom periscope mirror for measuring the position of the blue beam with respect to the alignment cross and the nominal position inscribed into the breadboard on the E3 floor to also adjust the tip/tilt angle of this mirror. See also Figure 25 .
Fig. 29. Arrival of the full-size HAPLS beam in P3, the TM-45, the TM-17.5 turn mirror both with their rear surface alignment cross and the  off-axis gold coated parabola with a focal length of
  . All components are pre-aligned with a laser tracker position and angle wise.
off-axis gold coated parabola with a focal length of . All components are pre-aligned with a laser tracker position and angle wise. Fig. 30. Calculated phase-to-amplitude modulations for the free space propagation of a 20th-order super-Gaussian beam, which has at 30 J a fluence of  (first row and second row left) with first and preliminary measured phase errors (second row right) over 53.6 m to P3. The VirtualLab Fusion, Zemax and in-house EMA-based code are in full agreement (third row). The peak intensity of these
  - and
- and  -lineouts is
  and the modulation depth is up to 28% with respect to the ideal super-Gaussian beam. Fourth row: Calculated 2D beam profile after 53.6 m of propagation, left with VirtualLab Fusion and right with Zemax. Fifth row: Same as the fourth row, but calculated with EMA-based code. The peak fluence of the propagated ideal super-Gaussian 2D beam is
  .
.
(first row and second row left) with first and preliminary measured phase errors (second row right) over 53.6 m to P3. The VirtualLab Fusion, Zemax and in-house EMA-based code are in full agreement (third row). The peak intensity of these - and -lineouts is and the modulation depth is up to 28% with respect to the ideal super-Gaussian beam. Fourth row: Calculated 2D beam profile after 53.6 m of propagation, left with VirtualLab Fusion and right with Zemax. Fifth row: Same as the fourth row, but calculated with EMA-based code. The peak fluence of the propagated ideal super-Gaussian 2D beam is . Fig. 31. X-lineout of EMA model prediction for the phase-to-amplitude modulations of an ideal flat fluence 20th-order super-Gaussian beam with the measured phase errors of the HAPLS beam for different propagation distances.
Fig. 32. HAPLS low-power alignment beam measured in P3 after 53.6 m of propagation. When scaled to 30 J operation, the peak fluence of the 2D beam is 200 mJ/cm2.
Fig. 33. Depth of amplitude modulation,  , as a function of propagation distance
  from the incidence plane for different modulation amplitudes: (a)
  mm, (b)
 λ = 15 mm and (c) λ = 30 mm for modulation depths  , 0.6 and 1.0.
, as a function of propagation distance from the incidence plane for different modulation amplitudes: (a) mm, (b) , 0.6 and 1.0. Fig. 34. Top: Schematic for monitoring the beam pointing stability in the P3 target chamber. Bottom: Focal spots images of full-aperture HAPLS beam (left) and 80 mm circular HAPLS sub-aperture (middle). The effect of switching off the P3 vacuum pumps is demonstrated with the blue alignment laser (right); see Section 8.4 for details. The images are overlayed with reconstructed centroid positions in each sample (black crosses) and with intensity projections (white curves).
Fig. 35. Photos of the image-monitoring system. The monitoring system 1 is for obtaining the NF intensity pattern and the wavefront of the HAPLS beam. The monitoring system 2 is for obtaining the focal spot image by the OAP.
Fig. 36. Diagnostic setup for the short focal length commissioning.
Fig. 37. NF and FF (focal spot) intensity patterns measured with the monitoring system: (a) NF pattern and (b) the focal spot image obtained with the 80 mm sub-aperture beam; (c) NF pattern and (d) the focal spot image with the full-aperture beam.
Fig. 38. (a) Zernike coefficients for the 80 mm sub-aperture beam. The error bar for each Zernike mode is its standard deviation. The absolute value ( ) for the defocus term is not shown. (b) The wavefront map reconstructed from the Zernike coefficients (a). (c) PSF calculated from (b). (d) PSF calculated from (b) after subtracting defocus and astigmatism. HO denotes higher order than astigmatism modes.
) for the defocus term is not shown. (b) The wavefront map reconstructed from the Zernike coefficients (a). (c) PSF calculated from (b). (d) PSF calculated from (b) after subtracting defocus and astigmatism. HO denotes higher order than astigmatism modes. Fig. 39. Wavefront maps for the  size laser beam in the target chamber.
size laser beam in the target chamber. Fig. 40. Top: The anchors used, going 400 mm deep into the concrete. Bottom: The distribution of the anchoring points and the individual levelling feet.
Fig. 41. FEM simulation results of P3 chamber floor deformation in z direction under vacuum force.
Fig. 42. Left: The central target table and one wedge from the inner and outer ring. Right: All 21 elements of the breadboard structure.
Fig. 43. Panorama of the present P3 breadboard configuration.
Fig. 44. Copper  emission recorded during an HAPLS 110 mJ single shot. Photons are emitted relatively homogeneously from the focal spot. The white dashed circle of
  diameter represents the emission area.
emission recorded during an HAPLS 110 mJ single shot. Photons are emitted relatively homogeneously from the focal spot. The white dashed circle of diameter represents the emission area. Fig. 45. (a) Vanadium target patterned in a series of laser bursts indicates a good reproducibility inside the same bursts. (b) Vanadium X-ray  spectrum recorded by an accumulation of 165 shots.
spectrum recorded by an accumulation of 165 shots.
|
Table 1. Summary of the laser parameters of the precision cleaning device used to clean the P3 chamber. It is based on a 1064.7 nm fibre laser with a flat-top profile
| |||||||||||||||||||||||||||||||||||||||||||||||||||||
Table 2. A summary of low-power laser pointing measurements in the P3 chamber compared with HAPLS pointing, measured in the L3 hall before the compressor. The number of focal spot positions measured to determine the pointing stability was 100 except for the blue laser 1 where we took 200 images. The camera was synchronized with HAPLS, i.e., had an acquisition rate of 3.3 Hz.


Set citation alerts for the article
Please enter your email address

© Copyright 2018-2021 | Chinese Laser Press. All Rights Reserved 沪ICP备15018463号-20