
Yilun Gu, Shengli Guo, Fanlong Ning. Progress on microscopic properties of diluted magnetic semiconductors by NMR and μSR[J]. Journal of Semiconductors, 2019, 40(8): 081506
- Journal of Semiconductors
- Vol. 40, Issue 8, 081506 (2019)
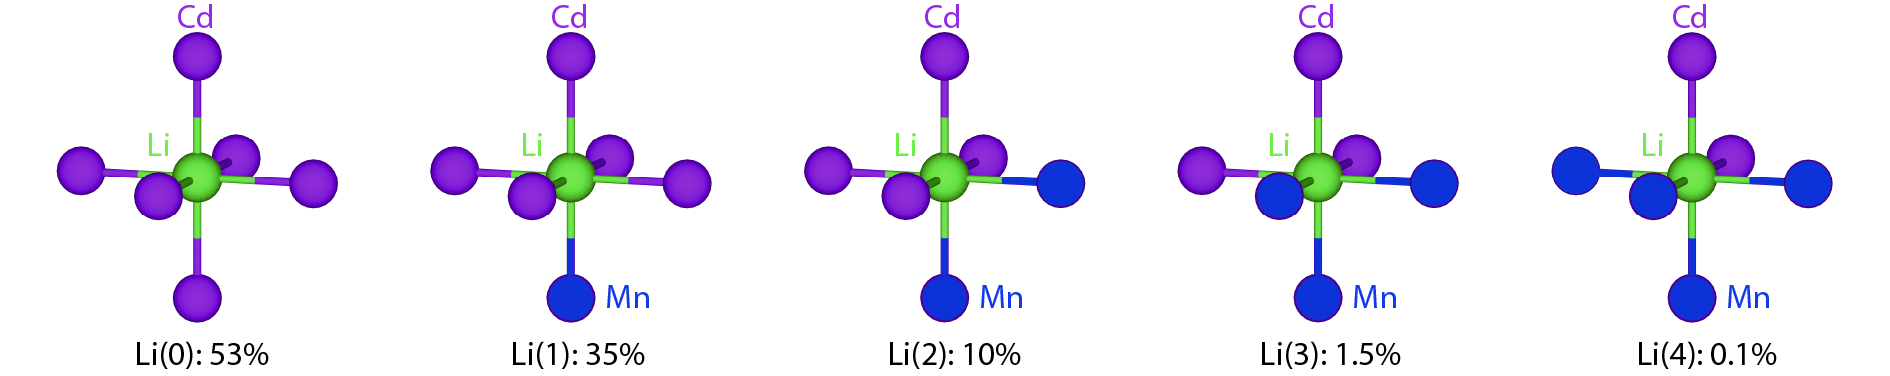
Fig. 1. (Color online) The probability to find Li(0), Li(1), Li(2), Li(3), Li(4) for 10% Mn doped into Cd sites in LiCdP. The number in bracket means the number of Mn atoms at N.N. Cd sites.
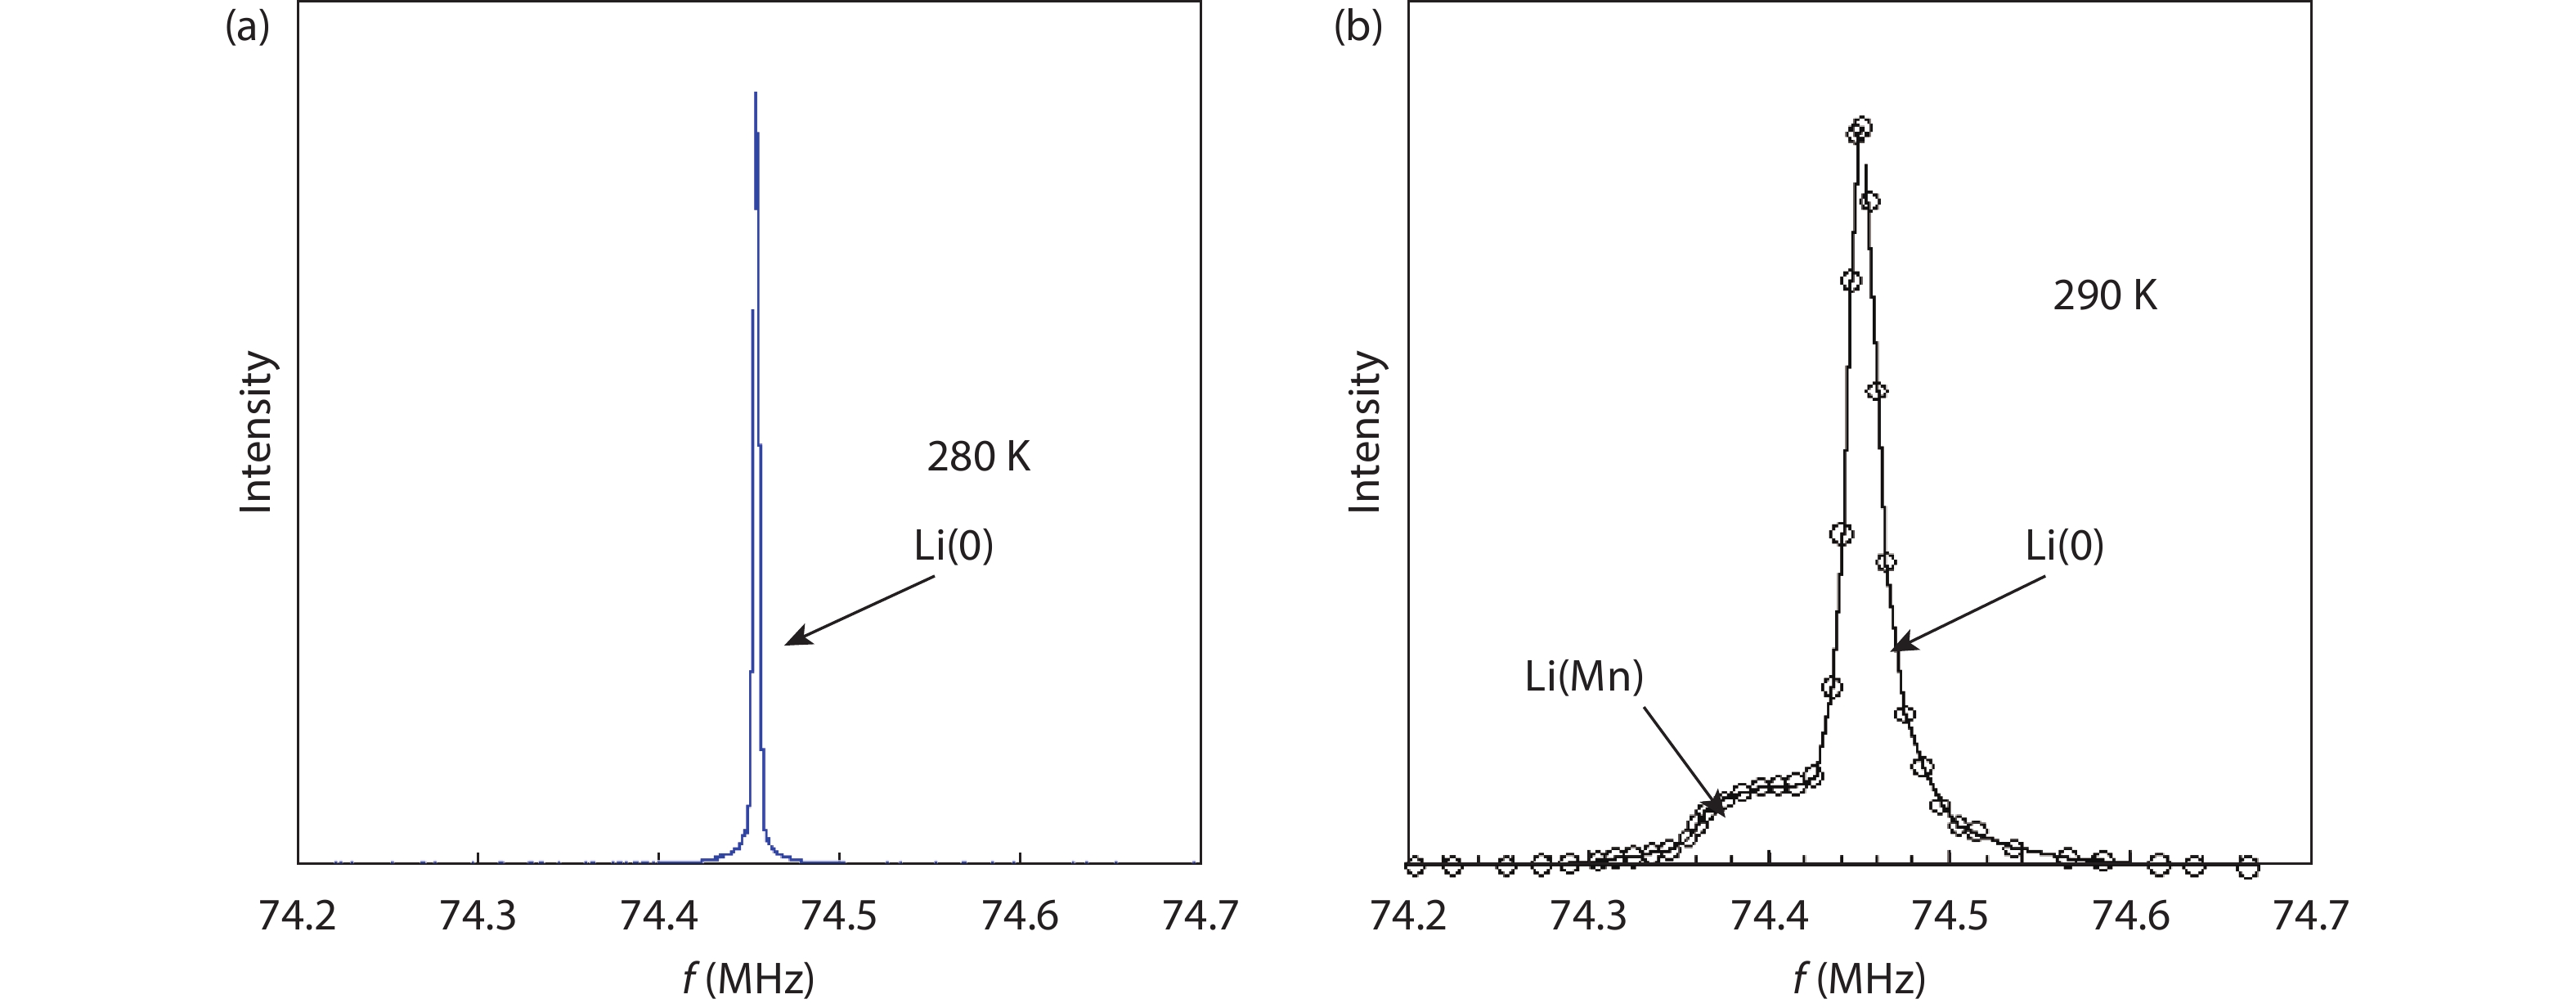
Fig. 2. (Color online) The representative 7Li line shapes of (a) Li1.1CdP and (b) Li1.1(Cd,Mn)P.
Fig. 3. (Color online) (a) The temperature dependence of the 7Li NMR Knight shifts, – 7K, at the Li(Mn)sites. The HHFW of Li(0) in Li(Zn
M measured at B ext = 100 Oe. (b) 1/T 1 of Li(0) and Li(Mn) of Li(Zn
28 ].
Fig. 4. (Color online) (a) The zero field μ SR time spectra of Li
17 ].
Fig. 5. (Color online) (a) The time spectra of LF-μ SR in (La
18 ].
Fig. 6. (Color online) Correlation between the static internal field parameter
μ SR versus Curie temperature
29 ].
Fig. 7. (Color online) (a) ZF-μ SR time spectra obtained in polycrystalline specimen of (Ba
μ SR measurements in ZF and WTF of 50 G. Inset: DC magnetization results of the specimens used in μ SR measurements. Adopted from Ref. [19 ].

Set citation alerts for the article
Please enter your email address
© Copyright 2018-2021 | Chinese Laser Press. All Rights Reserved 沪ICP备15018463号-20