
Xumin Cai, Xiuqing Lin, Guohui Li, Junye Lu, Ziyu Hu, Guozong Zheng, "Rapid growth and properties of large-aperture 98%-deuterated DKDP crystals," High Power Laser Sci. Eng. 7, 03000e46 (2019)
- High Power Laser Science and Engineering
- Vol. 7, Issue 3, 03000e46 (2019)
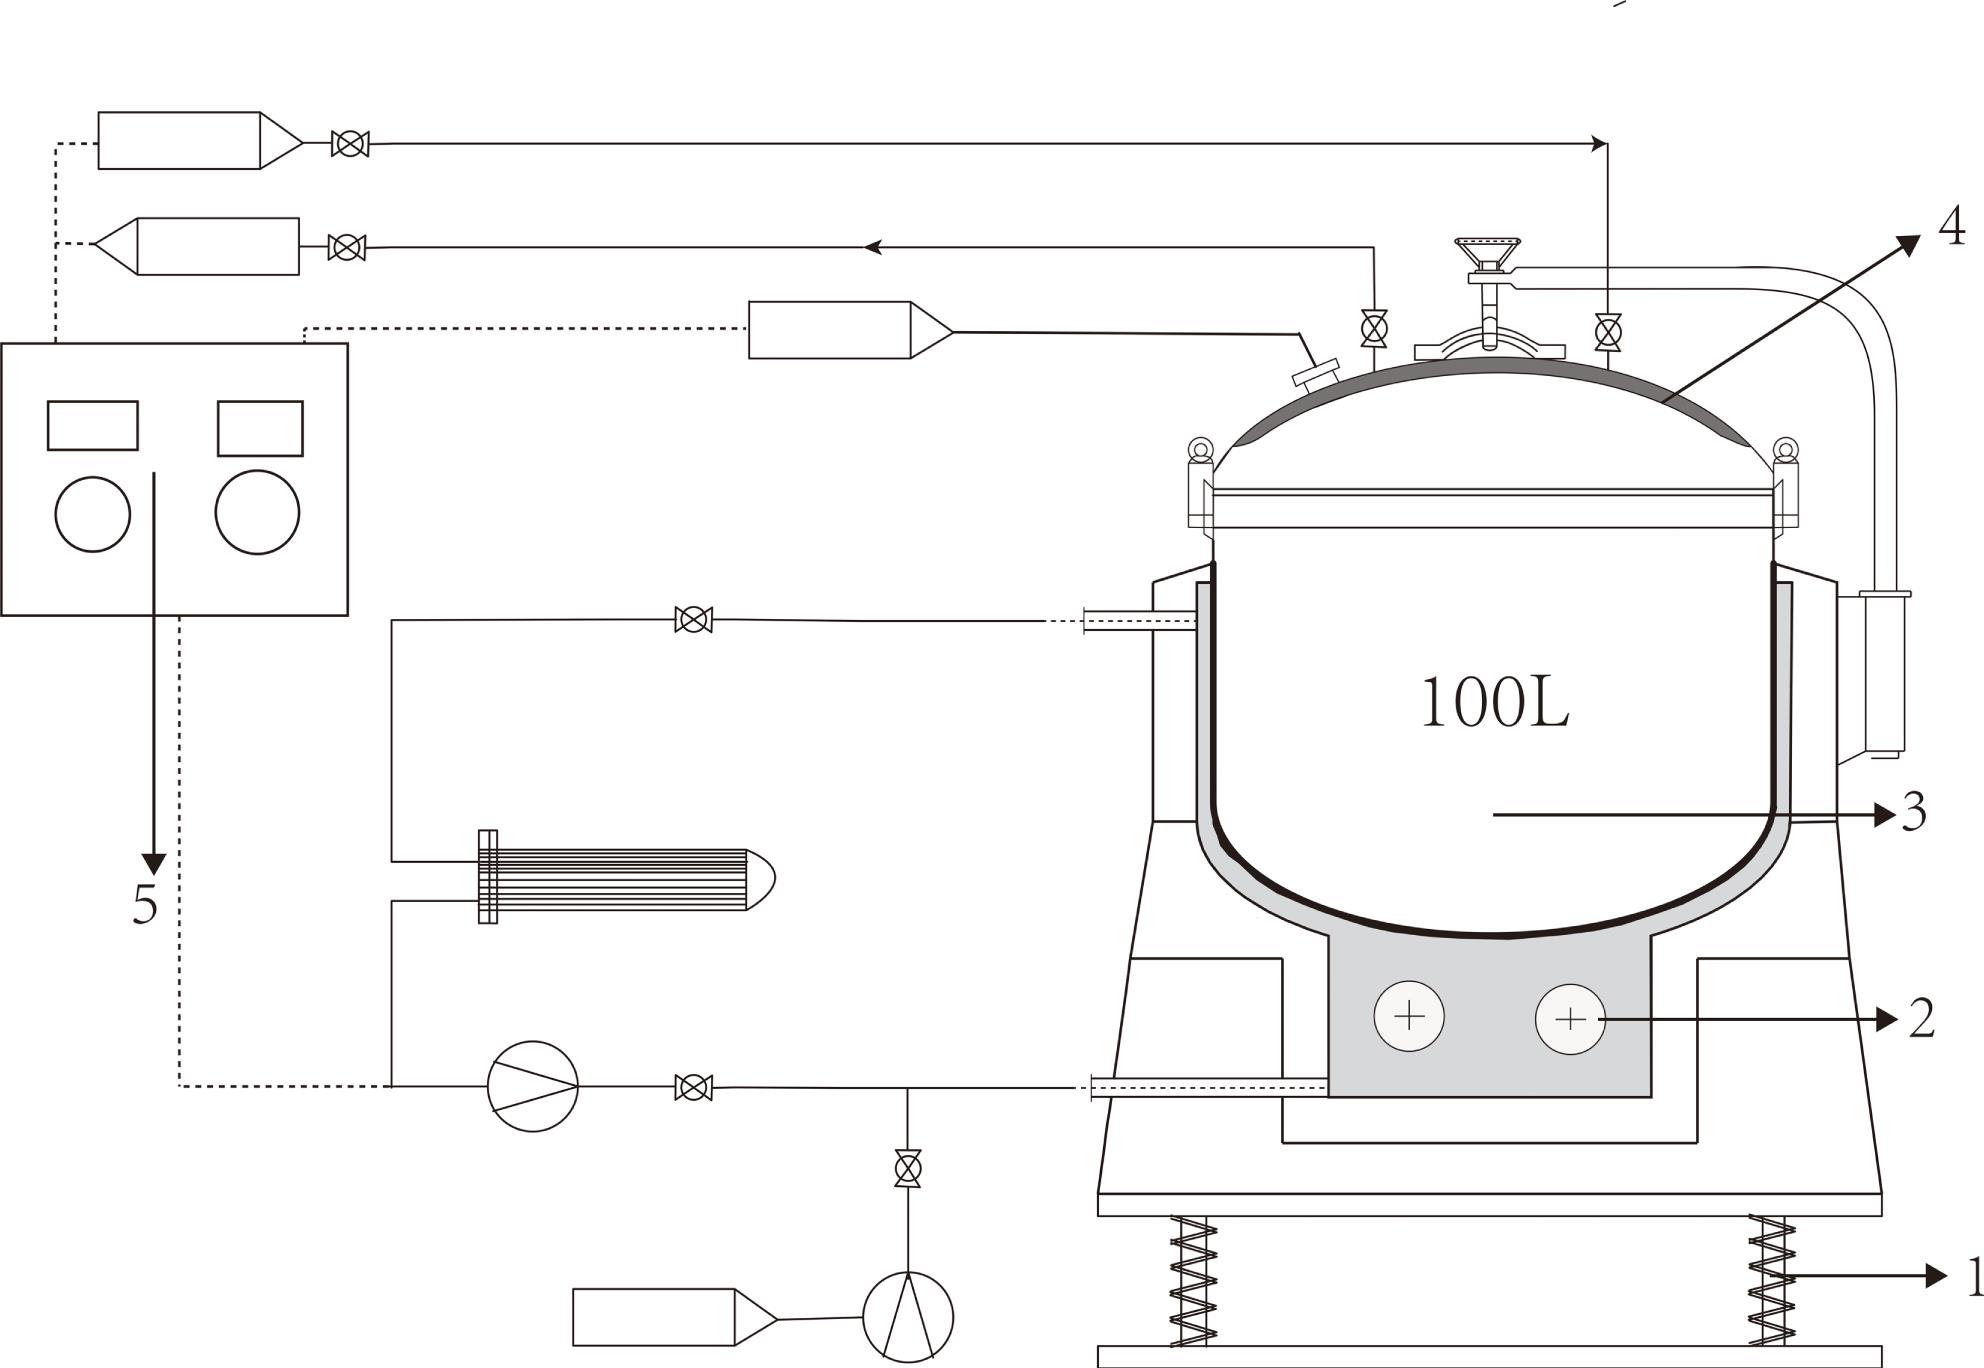
Fig. 1. Schematic of the 100 L synthesis tank device. 1, vibrating table; 2, heating unit; 3, synthesis container; 4, cooling system; 5, control system.
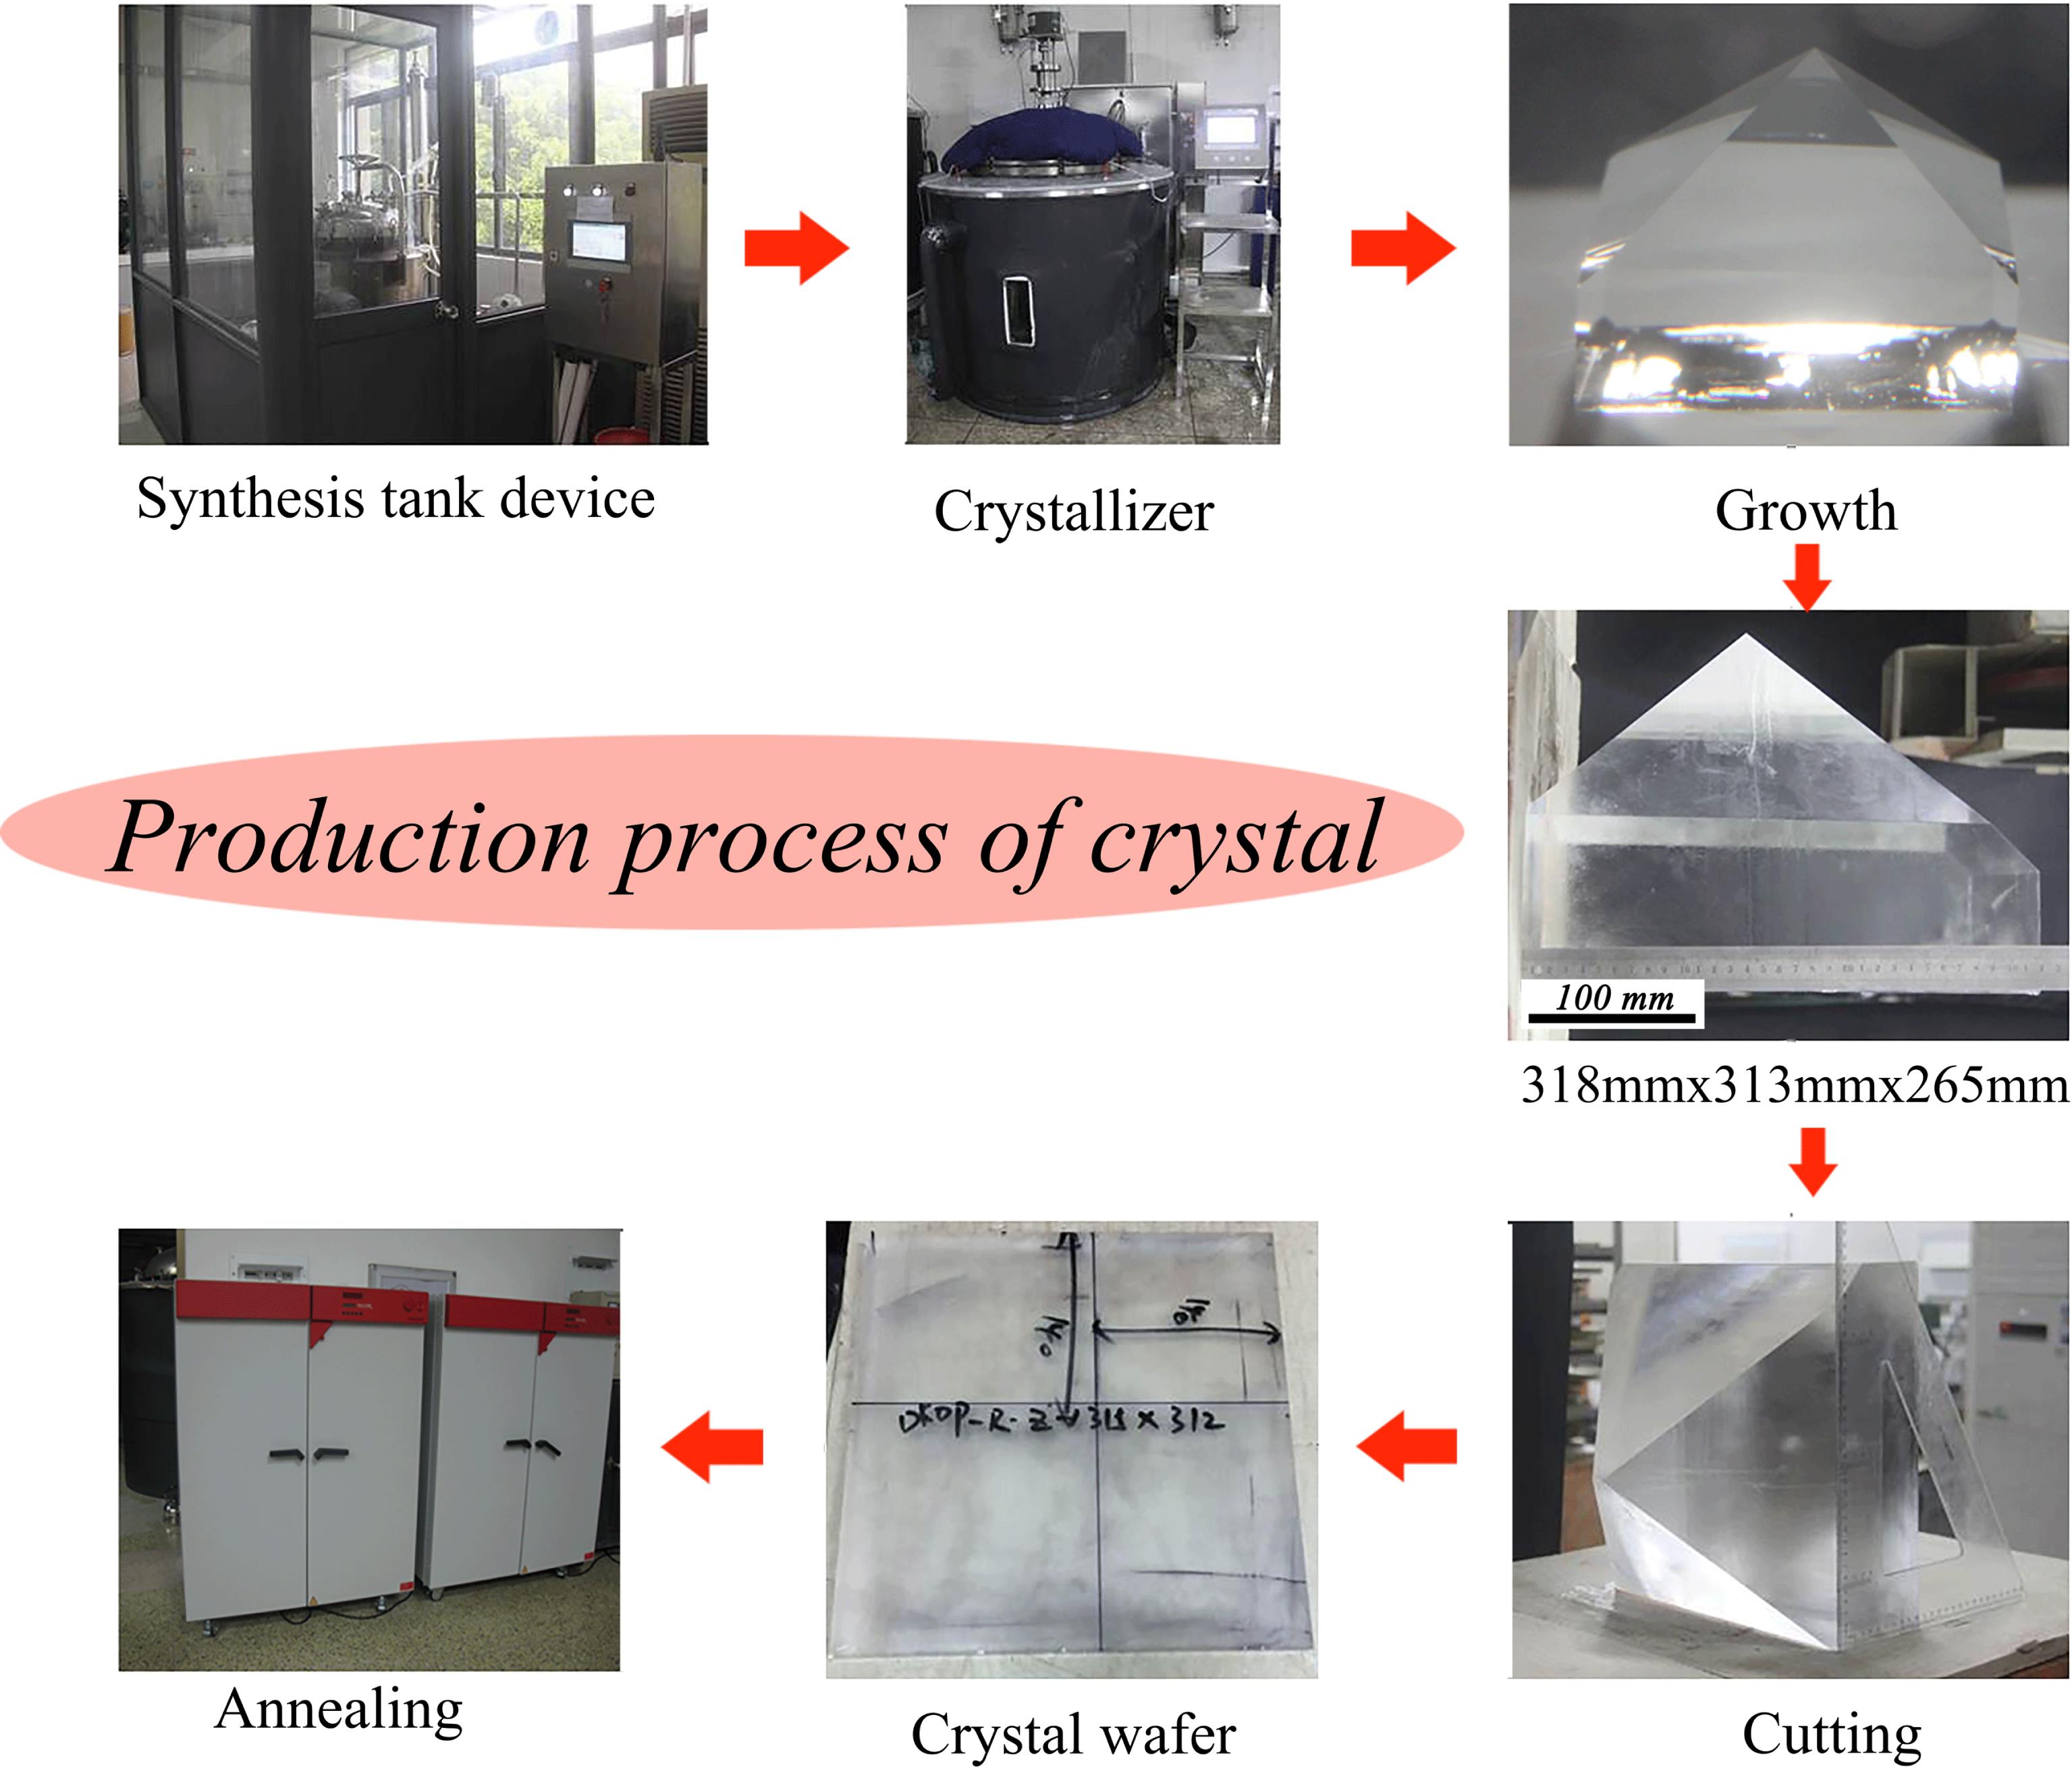
Fig. 2. Details of the DKDP crystal production process, including synthesis, growth, cutting and annealing.
Fig. 3. Experimental setup for measuring the LIDT, including shutter, waveplate, polarizer, focus lens, beam profiler and bulk detection.
Fig. 4. Locations of the samples used in infrared (IR) spectra measurements.
Fig. 5. IR spectra. The recorded spectra were measured by a spectrophotometer in the range 200–1800 nm.
Fig. 6. Locations of the samples used in TGA measurements.
Fig. 7. Thermo-gravimetric curve of DKDP crystals. The red curve represents the heating curve and the two black curves represent the TG curve of DKDP.
Fig. 8. Schematic cutting diagram for the different DKDP samples.
Fig. 9. Transmission spectra of different deuterium concentration DKDP and DKP crystals. The blue curve represents 97.9% DKDP crystal, the brown curve represents 70% DKDP and the red curve represents KDP crystal.
Fig. 10. Optical path schematic of the experiment.
Fig. 11. LIDT results. The inset gives the value of LIDT at the inflection point of the curve. The values for samples 1 and 2 are $43.9~\text{J}\cdot \text{cm}^{-2}$ and $35.6~\text{J}\cdot \text{cm}^{-2}$ , respectively.
|
Table 1. Concentration of the main metallic ionic impurities in $\text{P}_{2}\text{O}_{5}$
|
Table 2. Concentration of the main metallic ionic impurities in $\text{K}_{2}\text{CO}_{3}$
|
Table 3. Results for the deuterium level of DKDP crystal as assessed from IR spectra.
|
Table 4. Results of the residual mass and deuterium level of DKDP.
| ||||||||||||||||||||||||||||||||||||||||||
Table 5. Results for the transmittance and absorption coefficient with different deuterium levels in DKDP and KDP crystals.
|
Table 6. LIDT results at 8.8 ns, 3 ns and 10 ns.


Set citation alerts for the article
Please enter your email address

© Copyright 2018-2021 | Chinese Laser Press. All Rights Reserved 沪ICP备15018463号-20