
Kai Yang, Zhanshan Sun, Ruiqi Mao, Yi Lin, Yi Liu, Qiang An, Yunqi Fu. Wideband Rydberg atom-based receiver for amplitude modulation radio frequency communication[J]. Chinese Optics Letters, 2022, 20(8): 081203
- Chinese Optics Letters
- Vol. 20, Issue 8, 081203 (2022)
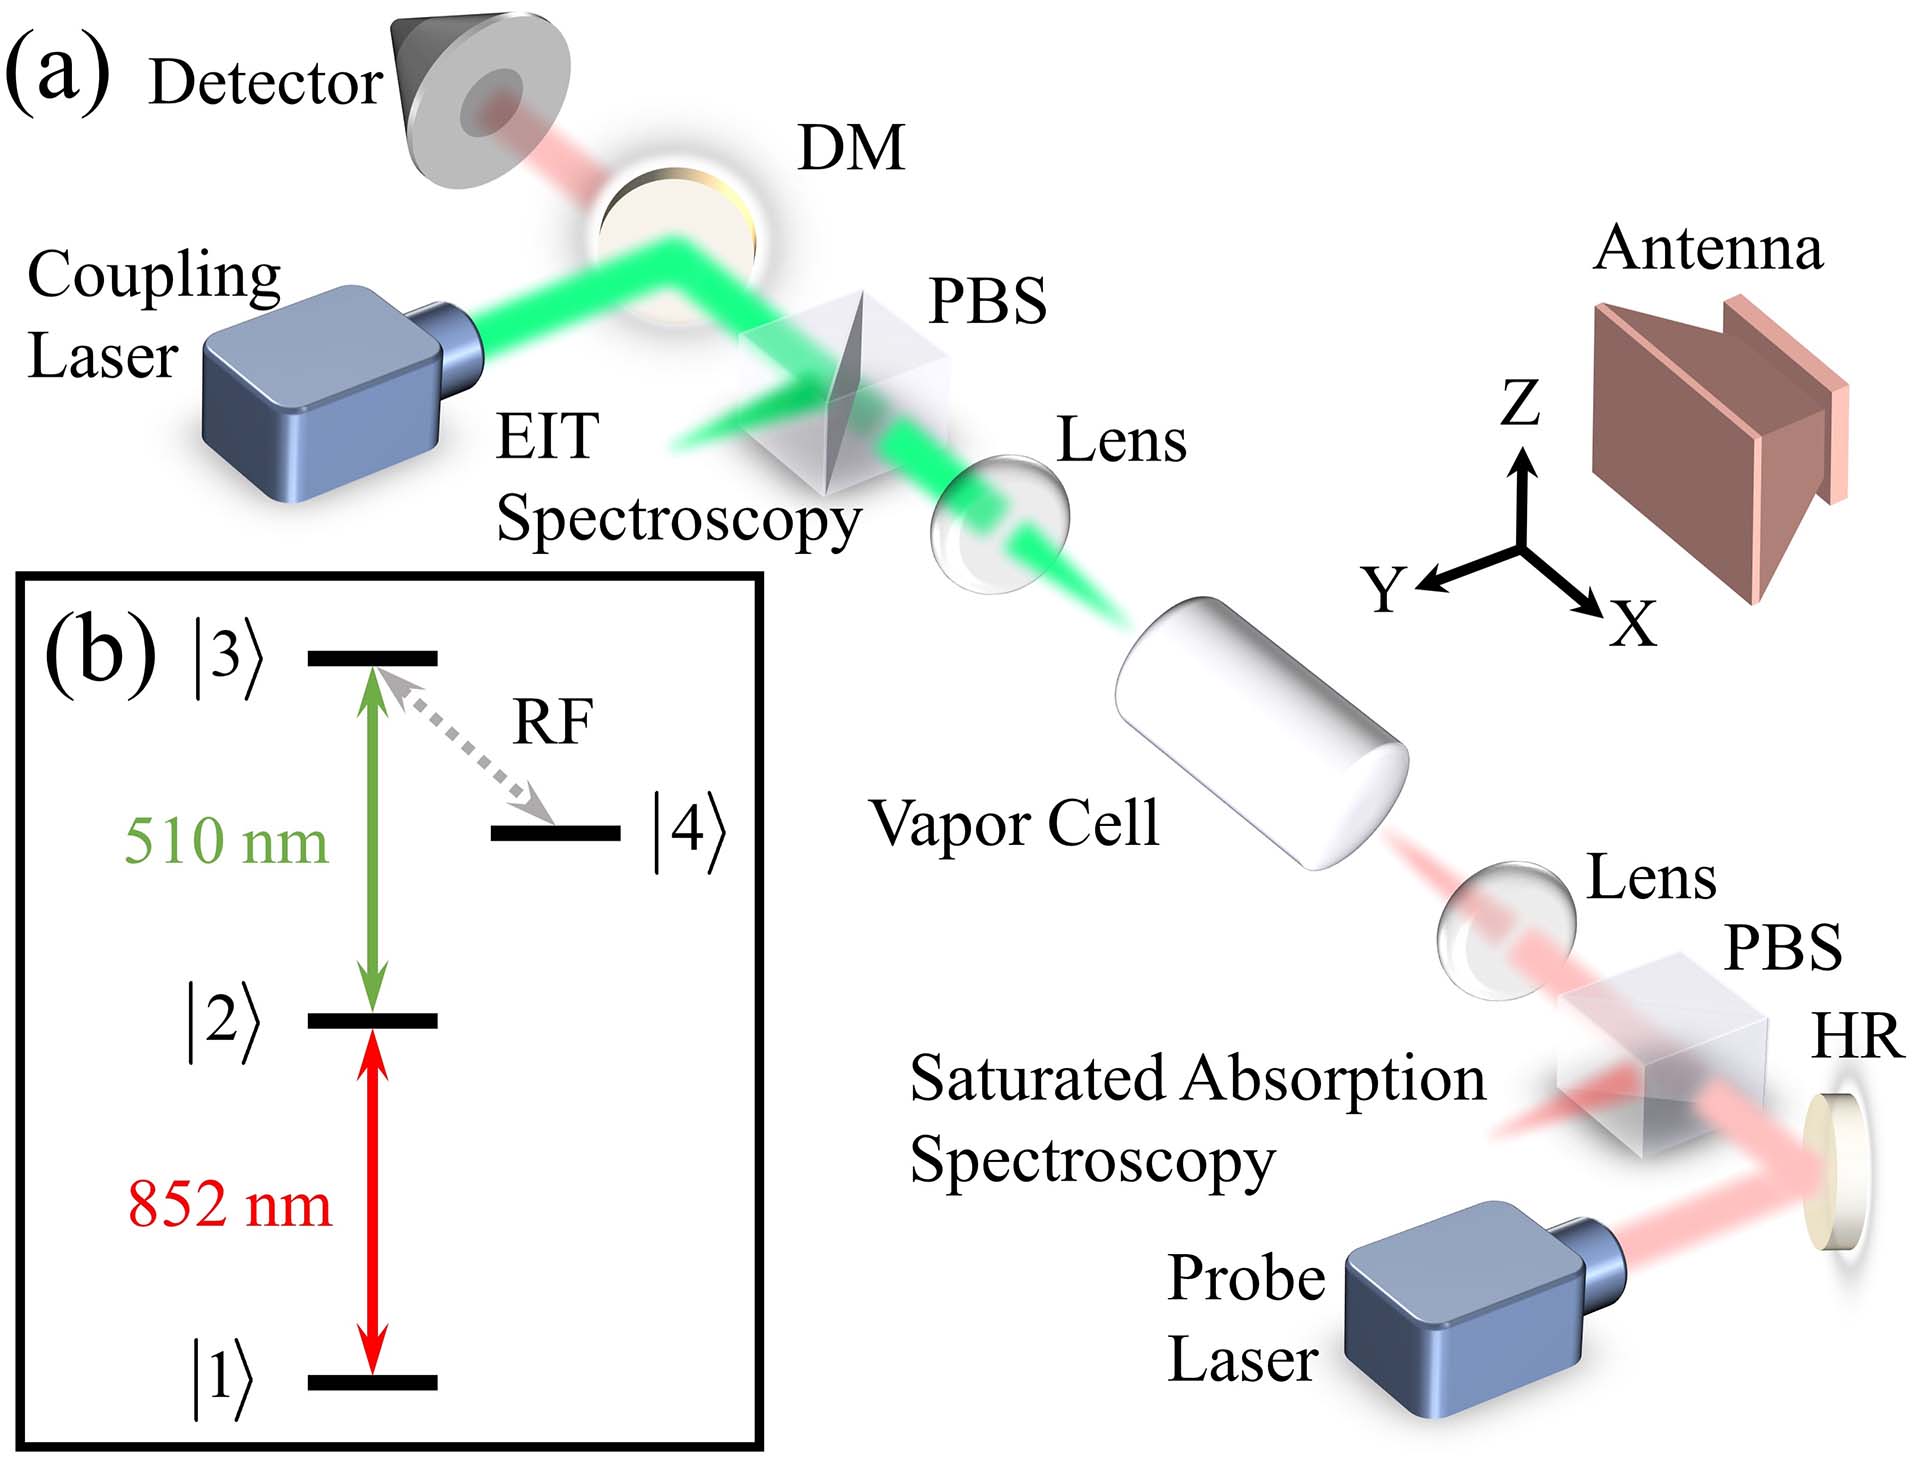
Fig. 1. Illustration of experimental scenarios and energy-level diagram. (a) Diagram of the experimental setup. DM, dichroic mirror; PBS, polarizing beam splitter; HR, dielectric mirror. (b) Energy-level diagram of the Rydberg EIT ladder scheme and resonant two-photon microwave transition.
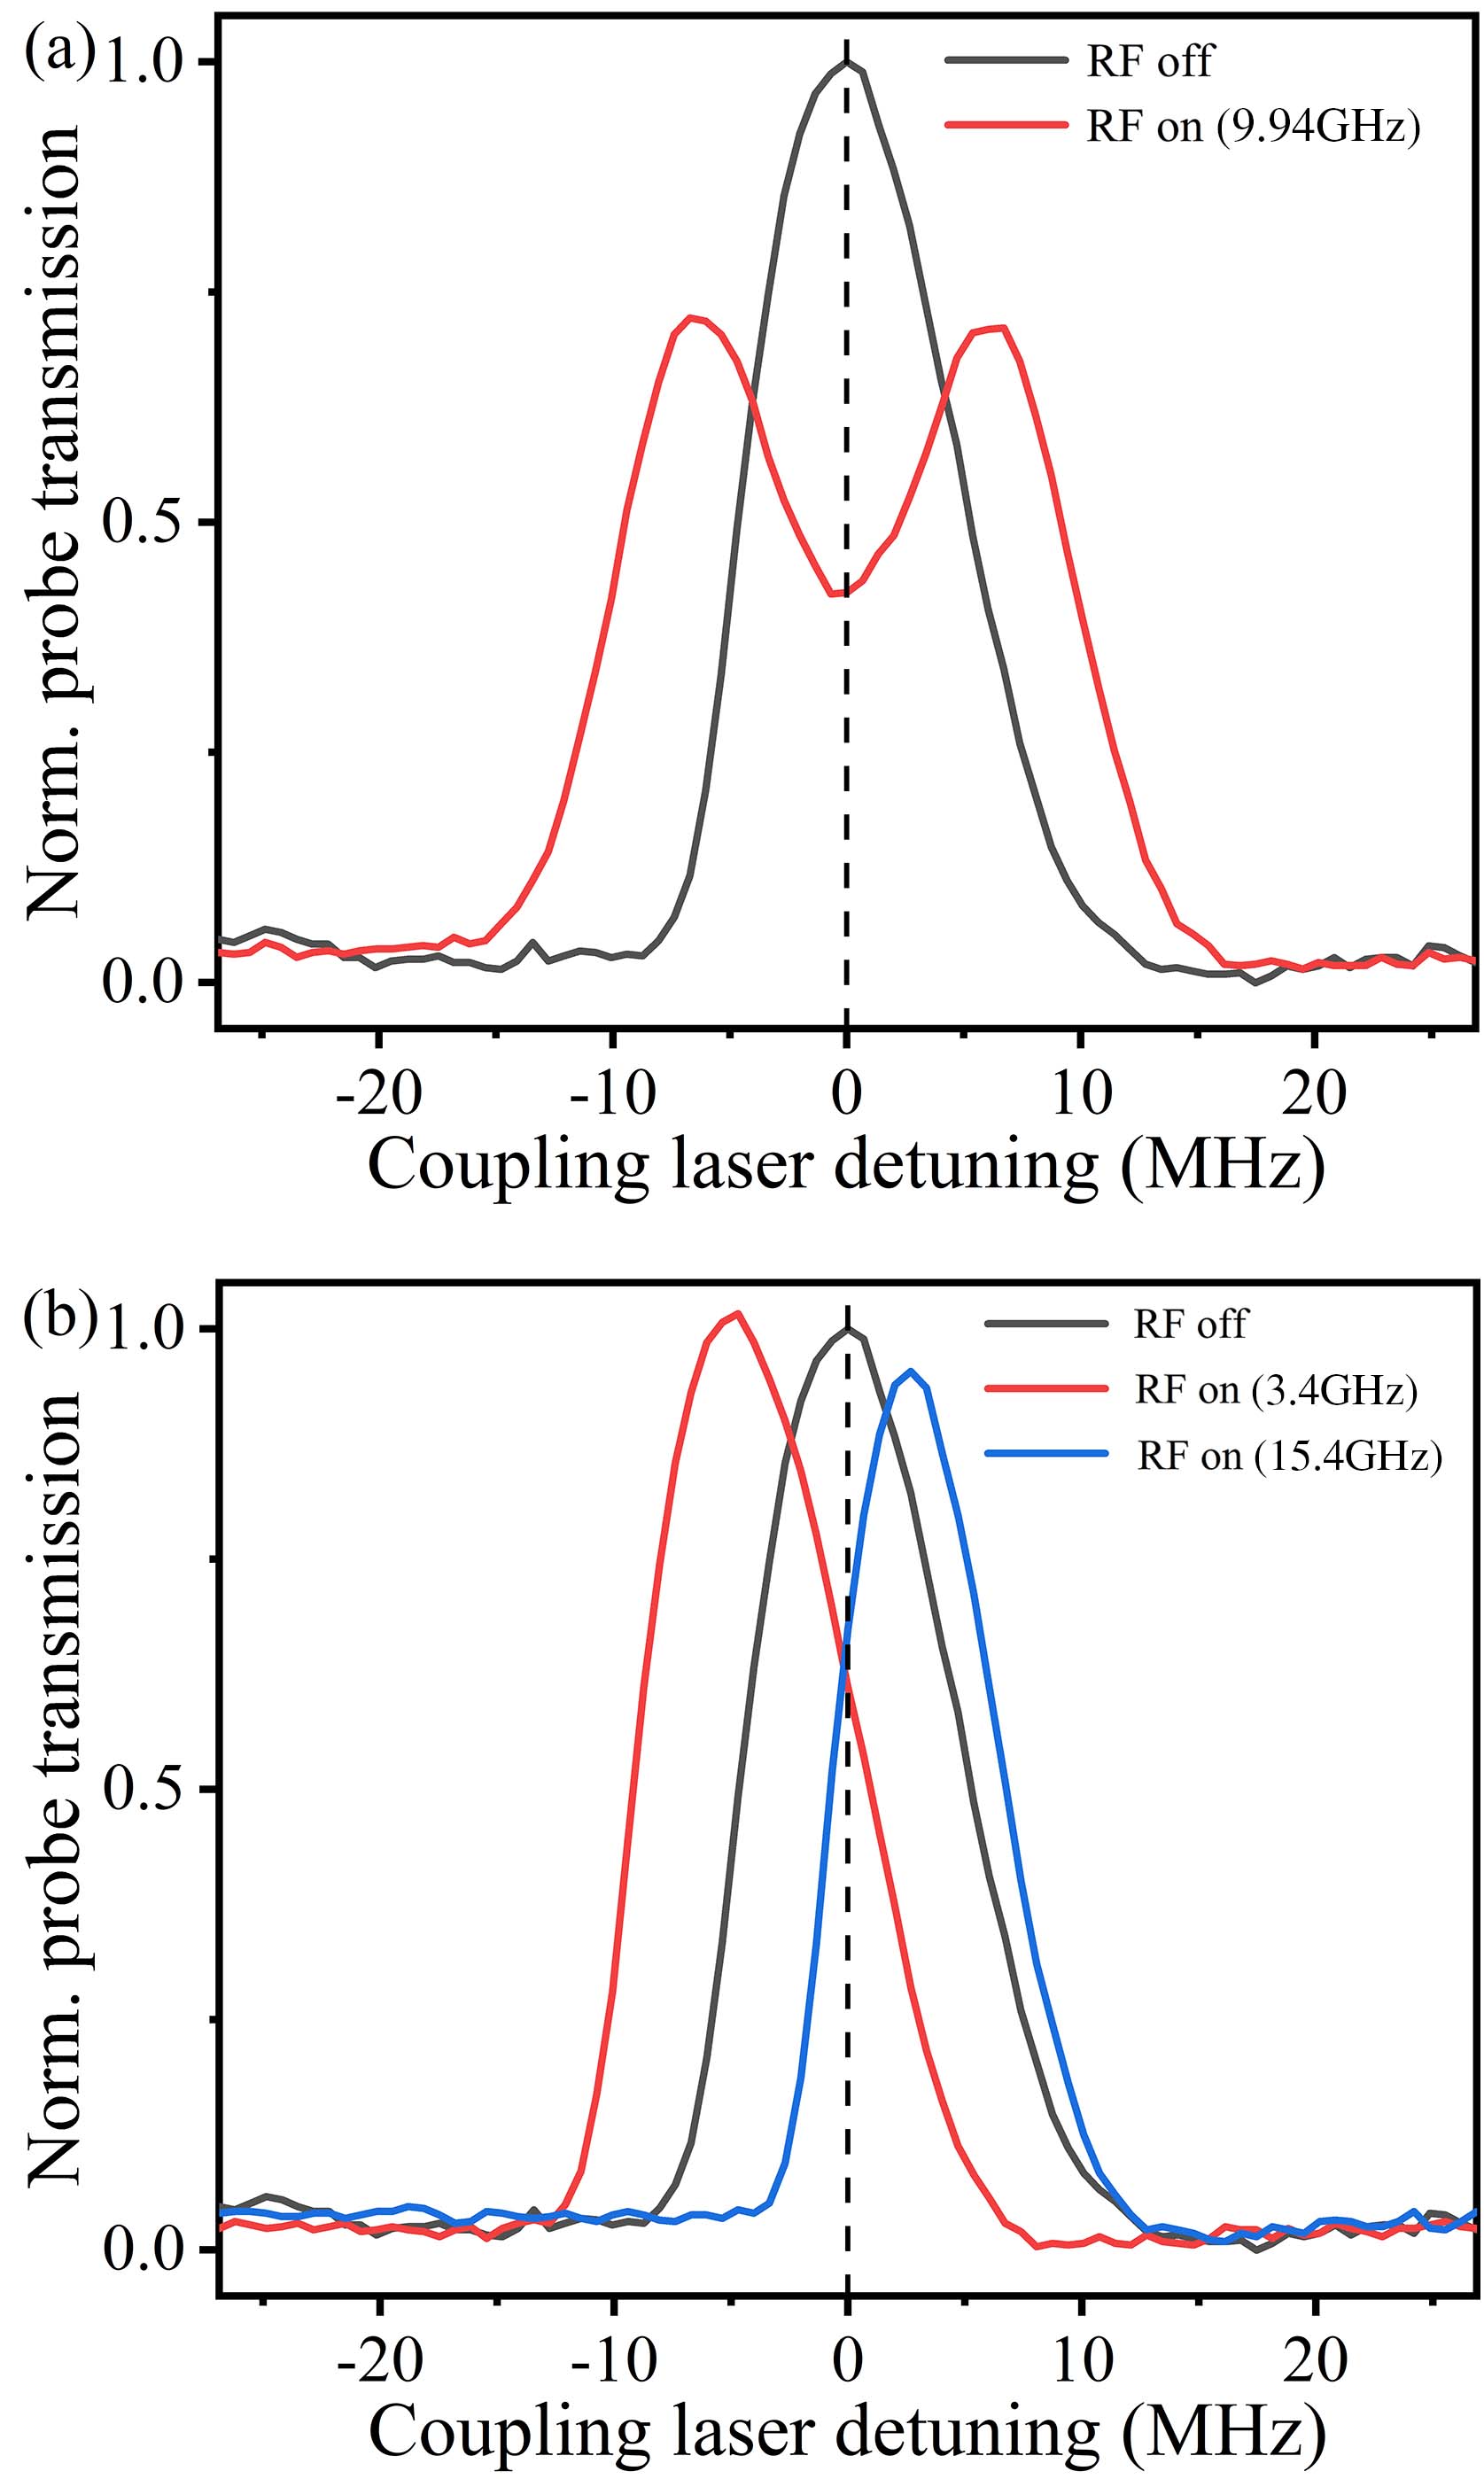
Fig. 2. Illustration of the normalized probe transmission signal as a function of coupling laser detuning. (a) On-resonance EIT spectra with (red curve) and without (black curve) RF field. The RF field frequency is 9.94 GHz. (b) Off-resonance EIT spectra with (red and blue curves) and without (black curve) RF field. The RF field frequencies are 3.4 GHz (red curve) and 15.4 GHz (blue curve).
Fig. 3. Optical response measured at 9.94 GHz carrier frequency with an AM frequency of 10 kHz. AM depths are set to be 10% (black curve), 30% (red curve), and 60% (blue curve), respectively, and the EIRP is 26.3 dBm. (a) Oscilloscope output. (b) Spectrum analyzer output.
Fig. 4. Measured SNR of the demodulated signal as a function of the EIRP at the RF carrier frequency of 9.94 GHz with an AM frequency of 10 kHz and a modulation depth of 60%. Inset: typical EIT-AT spectra, when the EIRP is large enough to cause the splitting width to be larger than the EIT linewidth at an RF carrier frequency of 9.94 GHz.
Fig. 5. Illumination of the SNR and data capacity as a function of AM frequency with a modulation depth of 60%. The RF carrier frequencies are 9.94 GHz (black, square) with an EIRP of 26.3 dBm, 3.4 GHz (red, circle) with an EIRP of 26 dBm, and 15.4 GHz (blue, triangle) with an EIRP of 29.8 dBm, respectively. The hollow symbols represent the experimental data of the SNR, and the solid symbols represent the data capacity calculated by Eq. (3 ).
Fig. 6. Illumination of the measured SNR (black) and corresponding EIRP (red) as a function of the RF carrier frequency with an AM frequency of 10 kHz and a modulation depth of 60%.

Set citation alerts for the article
Please enter your email address
© Copyright 2018-2021 | Chinese Laser Press. All Rights Reserved 沪ICP备15018463号-20